Measurements of low-energy, re-entrant albedo protons by the HEPD-01space-borne detector
Table of Contents
Abstract
Cosmic rays’ interactions with the residual atmosphere surrounding the Earth produce a variety of particles, like electrons, positrons, protons, anti-protons, and Helium nuclei that can be observed below the local geomagnetic cutoff. In this work, we present new measurements of downward-going, albedo proton fluxes with kinetic energy in the range ∼40–∼250 MeV, performed by the High-Energy Particle Detector (HEPD-01) on board of the China Seismo Electromagnetic Satellite – CSES-01 – at an altitude of ∼500 km. Employing a dedicated trajectory-tracing simulation routine, the protons collected by HEPD-01 are classified into quasi-trapped (QT), long lifetime (≳10 s) particles concentrating in the equatorial region of the Earth, and un-trapped (UT), distributed at all latitudes; the latter includes both precipitating short lifetime particles (UTS) and pseudo-trapped long lifetime (UTL) populations, abundant in the so-called penumbra regions. The temporal trend of re-entrant protons between 2018 and 2022 is also reported, assessing the stability of such population during the data-taking period of HEPD-01; this highlights their independence from the long-term modulating effect of the solar activity.
1. Introduction
Primary cosmic-ray (CR) particles are continuously impinging on the outermost layers of the atmosphere and interact with its nuclei, producing a wide variety of secondary particles. A certain amount ofthem are then scattered in an upward direction, taking the name of splash albedo particles. A fraction of this population is not absorbed in the atmosphere and becomes trapped by the geomagnetic field in closed-loop orbits, which causes them to return towards the Earth —hence the name re-entrant albedo particles. While the splash albedo particles have an upward direction with respect to the atmosphere, the re-entrant component is apparently indistinguishable from the primary component, since they are both down-going particles. The measured rigidity, direction of arrival and point of detection, however, can help in discriminating the two components; downward moving particles with rigidity below the local geomagnetic cutoff energy are expected to be re-entrant albedo, while those with rigidity above the cutoff threshold are mostly of primary origin [1]. The presence of the positively-charged albedo radiation has been known since late 1940s, thanks to the measurements of balloon experiments [2–6] and rockets [7,8]. As well as for protons, the geographical distributions of the albedo electron fluxes have been studied through a series of balloon-borne experiments — see, for example, the work of [9–11]. A few years after the discovery of the re-entrant albedo component, it has been found that they can be further divided into quasi-trapped and un-trapped. The former are more localized in the near-equatorial region, inside and below the inner Van Allen belt and they are characterized by features similar to those of stably-trapped protons in the radiation belts, although with much less intense fluxes [12–16]. On the contrary, the latter are spread over all latitudes [17,18]. This population is rather stable over time, as shown in [19–23]. A detailed description of the characteristics of each population will be given later in the paper. The results obtained by HEPD-01 in this work prove its capabilities in precise proton measurements, placing it alongside other experiments like PAMELA [24], AMS-01 [25] and AMS-02 [26], in a complementary energy range.
2. Limadou mission and the HEPD-01 detector
The CSES-01 satellite [27] was launched on February 2, 2018, and is currently flying on a sun-synchronous polar orbit at ∼500 km altitude, 97◦ inclination, and ∼5-day revisiting periodicity. It is the first of a network of multi-instrument satellites scheduled for launch in a few years. The mission objectives include monitoring the electromagnetic field, plasma, and particle perturbations in the ionosphere and magnetosphere, either due to natural sources, like earthquakes, or artificial emitters. The orbital characteristics of CSES-01 allow for a detailed investigation of the high-latitude regions of the Earth – the ones more sensitive to the influence of the Sun, even though all payloads are switched off at ±65◦ of latitude (increased to ±70◦ after 2019). The High-Energy Particle Detector (HEPD-01) – completely designed and integrated in Italy in the framework of the CSES/Limadou project –is one of the nine instruments on board the satellite. HEPD-01 is a light and compact payload (40.36 × 53.00× 38.15 cm3, total mass ∼45 kg), made up of a series of sub detectors: from the top of the detector, two double-sided silicon microstrips planes providing tracking information, a single layer of EJ-200 segmented plastic scintillator, a range calorimeter for energy measurement, composed of a stack (TOWER) of 16 plastic scintillators, P1…P16, and, finally, a 3 × 3 matrix of Lutetium-Yttrium Oxyorthosilicate (LYSO) inorganic scintillator crystals. The instrument is surrounded – laterally and at the bottom – by 5 plastic scintillators that reject out-of-acceptance particles or that do not deposit all their energy inside the detector (VETO). Nominally, the payload is optimized to measure electrons in the 3–100 MeV energy range and protons with kinetic energy between 30 and 300 MeV, as well as light nuclei. The HEPD-01 capabilities in solar, galactic, and trapped proton measurements have already been shown in [28–31]. Furthermore, observations of re-arrangements/variations of low-energy populations inside the Earth’s magnetosphere can be found in [32,33]. A more technical overview of the mission and on the detector is given in [34–37].
3. Data analysis
As mentioned in Section 2, the circular, quasi-polar orbit of the CSES-01 satellite allowed for continuous data-taking in the mid/low-latitudes (excluded a few days due to the inactivity of the payload), while above ±70◦ the payload was turned off for maneuvering reasons. During the period of data-taking (cfr. Section 3.1), along its trajectory, HEPD-01 encounters mainly electrons/positrons and protons (trapped, galactic, and under-cutoff). A reliable separation technique is crucial to discriminate between these populations — see Section 3.2. A description of the models used during the analysis is given in Section 3.3. An organic overview of the classification of proton families and their main characteristics, together with the description of the trajectory-tracing software employed in such studies is reported in 4 and 5. Results will be given in Section 6 and, finally, conclusions are drawn in Section 7.
3.1. Data set
The data analyzed in this work includes ∼8 million protons with kinetic energy between ∼40 and ∼250 MeV, acquired by the HEPD-01 instrument between August 1, 2018 and June 30, 2022 — corresponding to approximately 950 days of active data-taking. A sub-sample of this data (∼2 years) has been studied with a trajectory-tracing routine to attempt a classification of under-cutoff protons. Periods of strong solar activity (when >M5.0 class solar flares took place) during late 2021 have been removed from the general sample, to avoid the risk of contamination from solar protons penetrating the magnetosphere. This corresponds to a total of 14 solar events (∼40 days), including the Ground-Level Enhancement of October 28, 2021 (X1.1 class), which caused strong effects also on ground [28].
3.2. Proton identification
A complete account of the procedure employed for proton selection in HEPD-01 is provided in separated papers [29,30]; a summarized description is presented here. To be considered a valid trigger, a particle must produce signals in one of the trigger plane paddles (offline we require a single paddle hit to avoid multi-particle events and reduce secondaries) and on at least the first two planes of the TOWER, P1, and P2. Among the events satisfying this request, only those particles fully stopping inside the TOWER+LYSO sub-detector are included in the flux sample, discarding the ones generating signals in the VETO planes as a consequence. To discriminate between protons and electron/positron populations, we applied a selection on the signal deposited on the first TOWER plane (P1) as a function of the total energy deposited in the TOWER+LYSO sub-detector (see Figure 2 of the [29] paper). Other auxiliary selections are applied to further clean the sample from contaminating particles without decreasing the net instrumental efficiency. A series of dedicated, GEANT4 simulations have been carried out to estimate the acceptance (see Figure 4 in [29]), the various instrumental efficiencies and to correct the final spectrum for particle slow-down and energy loss in the passive structures covering the sensitive materials of the apparatus (spectral unfolding). Systematic uncertainties have also been estimated using these simulations.
3.3. Under-cutoff proton sample
To distinguish between protons coming from outside the magnetosphere and the under-cutoff, re-entrant populations, a 5◦ ×5◦ static map of rigidity cutoff as a function of geographical coordinates has been employed. The grid of values included not only vertical rigidities but also an estimation of both lower and higher boundaries for the rigidity cutoff, linked to the aperture of the HEPD-01 field of view. This map was constructed using IGRF [38] and TS96 [39] magnetospheric models, describing both internal and external geomagnetic field sources, respectively. To be consistent with the CSES-01 orbit, the magnetic field was evaluated at ∼500 km of altitude. The values of the McIlwain parameter L, extracted from these models, have been subsequently corrected using the latest coefficients of the AACGM (Altitude-Adjusted Corrected Geomagnetic) coordinates reference frame [40]. At different latitudes and longitudes, and consequently, for different values of L, the percentage of albedo protons was different; as L increased, the geomagnetic cutoff was lower and lower, allowing for more galactic protons to be detected in the sample. From an operative point of view, selecting L values > 7 guarantees a ∼50 MeV proton to be galactic. The same geomagnetic selection was applied to the estimation of the live time of the instrument, for obvious consistency reasons.
4. Trajectory classification
Each proton, selected under the geomagnetic cutoff, has been propagated forward and backward in time in the Earth’s magnetosphere to study its maximal trajectory. The tracing routine solves the relativistic Lorentz equation, d ⃗p∕dt = q(⃗v × B⃗), of a particle with charge q in the geomagnetic field B⃗ through a classic Runge–Kutta method with
adaptive control of the time stepsize [41]. The tracing initial conditions are the particle detected position, assumed being the satellite location and calculated with a simplified perturbation model1fed by the Two-Line-Elements of the CSES-01 satellite2, and the particle momentum, calculated from HEPD-01 energy and direction measurements. Tests with subsets of the dataset obtained variating the particle arrival direction within the angular resolution (∼10%) and the energy within the energy resolution (∼20%) have shown changes in particle nature only in <1% of the cases. The employed magnetic field B⃗ is obtained by combining the latest International Geomagnetic Reference Field (IGRF-13) — describing the main component of the geomagnetic field caused by sources primarily inside Earth [42] – and the Tsyganenko model (TS05) [43] for the external geomagnetic field sources. The backward-in-time propagation is realized by solving the same equation of motion after flipping the particle charge sign and inverting its momentum direction. Each particle is traced backward or forward until one of the following conditions occurs: [i] the particle crosses a sphere located at 50 Earth’s radii (galactic or solar cosmic ray), [ii] the particle is traced for more than 10 revolutions around the Earth (stably trapped), [iii] the particle crosses the Earth’s atmosphere limit, set at 40 km above the Earth’s surface (as in [44]), the particle is then classified as generated or absorbed by an interaction in the atmosphere (albedo or re-entrant). The populations of galactic and the stably trapped protons have been studied with HEPD-01 in previous works [30,31], and protons that fall in those categories are discarded. Only the albedo particles with generation and absorption points in the atmosphere are considered in the following. Each particle has an associated lifetime given by the sum of the forward and backward propagation times, as defined in [44,45]. The derived generation and absorption points are an approximation of the real generation and absorption points since the atmosphere has a vertical spatial distribution that is only approximated in our tracing. To further classify albedo trajectories is useful to introduce the approximated superimposition of three quasi-periodic motions of the geomagnetically trapped particle motion. These three motions have different time scales and are (i) a fast gyration motion of the particle around the magnetic field line with a period τgyro estimated instantaneously from Larmor period, (ii) a north–south bouncing motion with period τbounce estimated using mirror-to-mirror point time intervals, and (iii) a slow drift motion around the Earth with period τdrift calculated from total propagation time normalized to the number of revolutions around the Earth. Three different categories of albedo particles, generated and absorbed in the atmosphere, emerge.
• Quasi-trapped (QT): these trajectories are similar to those of the stably trapped population, but with a total propagation time between generation and absorption of the scale of the drift period τdrift. Similarly to the stably trapped, there is a hierarchy between the three motion components τgyro∕τbounce ≤ 0.1 and τbounce∕τdrift ≤ 0.01. Also, similarly to the stably-trapped, they are almost equatorial, with large equatorial pitch angles, and with an energy well below the rigidity cutoff. The difference between stably trapped and QT particles is essentially due to the eccentricity of the geomagnetic field.
• Untrapped Short (UTS): these trajectories are also similar to the stably-trapped, since τgyro∕τbounce ≤ 0.1 and τbounce∕τdrift ≤ 0.01, however their lifetime is comparable with the τbounce since they typically survive only a few bounces. These particles are produced with a relatively small equatorial pitch angle and have a mirroring point that is within the atmosphere.
• Untrapped Long (UTS): these trajectories are characteristically different from the others, more irregular, and without periodicity. As a consequence, the lifetime of such particles can be very long. These trajectories are observed at high latitudes, with energies close to the rigidity cutoff. A 3-D visualization of the trajectories of under-cutoff protons is
shown in Fig. 1 for the three categories considered. Fig. 2 shows the distribution of the lifetimes of the aforementioned proton albedo populations as a function of the magnetic latitude, obtained using the AACGM coordinate system. Different proton populations occupy different sectors of the plot, with QT protons localized at low latitudes – near the South Atlantic Anomaly (SAA) region –with lifetimes of a few tens of seconds. UTS are spread all over latitudes, with much shorter lifetimes. A double-band can be spotted in UTS distribution, corresponding to albedo protons crossing the magnetic equator once and twice, respectively. UTL protons, instead, are restricted to the higher latitudes, with a lifetime extending up to ∼100 s. Fig. 3 displays the lifetimes of albedo protons at magnetic latitudes lower than ∼30◦ as a function of the particle energy (left panel) and as a function of the product RL2 (right panel), where R is the particle rigidity. Even in these cases, the various families are well distinguished. The energy dependence is particularly interesting since it points to a difference between QT and UTS protons. The first is characterized by lifetimes of the order of τdrift – which scales with 1∕γβ2 – while the second has lifetimes of the order of τbounce – which scales with 1∕β [44,45]; this gives QT and UTS protons a different proportionality with the energy, with the former presenting a greater energy dependence than UTS, as it is visible from the left panel of Fig. 3. The main population of QT protons extends up to 20–30 s, but other QT bands are present with lifetimes close to 1 min; these bands correspond to protons traveling around the Earth (complete revolution) more than once. The right panel of Fig. 3 displays QT, UTS and UTL protons all below ∼15 GV R2 E, corresponding to the maximum Störmer vertical cutoff [46]. Above the threshold, particles start losing their characteristic periodicity, trajectories become more irregular (pseudo-trapping motion), lifetimes start becoming much broader, and galactic protons enter the sample with their open trajectories. This borderline region, where both sub-cutoff and galactic components are simultaneously present, is called penumbra.
5. Generation and absorption points
The point where the trajectory of a proton crosses the atmosphere (set to a fixed value of 40 km in this work) after being back-propagated is called a generation or production point; this means that, at that specific point of the atmosphere, a re-entrant albedo proton is generated. Conversely, the point where the trajectory intersects the atmosphere after being propagated forward is called the absorption or sink point;
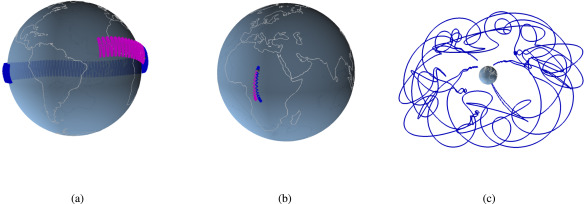
Fig. 1. A 3D visualization of the reconstructed trajectories. In all graphs, the blue (magenta) line is the trajectory traced backward (forward) in time. From left to right we have (a) a 186 MeV QT proton with an equatorial trajectory with a generation point over the Pacific Ocean and absorption point over the Atlantic Ocean, (b) a 240 MeV UTS proton bouncing in the northern hemisphere, and being absorbed in the southern hemisphere, and (c) a 31 MeV UTL proton detected at high latitude.
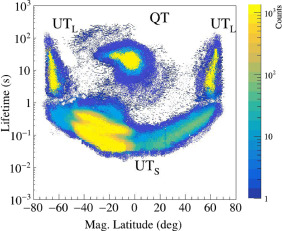
Fig. 2. Distribution of the lifetimes of the proton albedo populations as a function of the AACGM magnetic latitude. Different proton populations – QT, UTS and UTL occupy different sectors of the plot.
in this case, the re-entrant proton has been captured by the atmosphere and it is lost. This situation is depicted in Fig. 4, with generation points in the left panels and absorption points in the right ones. QT protons (upper panels, in blue) are produced westward with respect to the SAA, where the offset in the Earth’s magnetic dipole center causes the magnetic field to be at its minimum here [47–49]. While moving away from the SAA (westward), magnetic fields become stronger and stronger, the altitude of the mirror points consequently increasing, and proton keep drifting in this direction until they cross again sectors with weaker magnetic fields, on the East side of the SAA; here protons are absorbed by the atmosphere and disappear. The locations of both production and sink points are a direct consequence of the multipolar nature of the geomagnetic field [44,50]. The UTS albedo component (middle panels, in red) are short-lived and they are generated and absorbed over a very brief period of time; for this reason, the intersections with the atmosphere take place very close to the detection point. As can be observed in the middle-left panel, they are originated in the SAA and in a adjacent region located in the northern side of the Anomaly; shortly afterward, they are absorbed in the SAA (see middle-right panel); Finally, similarly to UTS, pseudo-trapped albedo protons (bottom panels, in green) are uniformly spread all over the geographical longitudes covered by the satellite, but their mirror points are situated at the highest latitudes – rather far from each other –justifying their longer lifetimes.
6. Results
Albedo proton fluxes Φ were defined as a function of kinetic energy and in intervals of magnetic latitudes and L values, under the hypothesis of an approximately isotropic particle distribution (no pitch angle dependence), as done in [44]. The differential spectra Φ(E) were evaluated as follows:
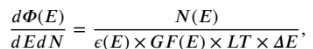
where N(E) is the number of protons, ε(E) the total (instrumental plus selection) efficiency, GF(E) the geometrical factor, LT the Live Time, and ΔE the width of the energy interval. The single factors in Eq. (1) have been estimated using the information presented in Section 3.2 and in [29,30]. Spectra for the three albedo proton populations, introduced in
Section 4 in three ranges of magnetic latitude Λ are displayed in Fig. 5, averaged over all pitch angles. The SAA region, defined as the region with a value of the geomagnetic field greater than 24000 nT, has been excluded. Left panel refers to the equatorial region |Λ| < 20, where the flux of UTS (red) and QT protons (blue) is almost the same at all energies. At this low latitudes, in fact, quasi-trapping conditions are still strong near the SAA and QT albedo are generated and absorbed in its proximity. In the middle panel – corresponding to the magnetic latitude 20 < |Λ| < 40 – the flux of QT proton is strongly depressed since mirror points are only limited to low latitudes; on the other hand, the spectrum of UTS protons is almost unchanged, a direct consequence of the fact that mirror points for this population are spread almost all over longitudes/latitudes. Finally, in the right panel (40 < |Λ| < 60), UTL component (green) becomes more important, as near-polar latitudes are reached. Fig. 6 reports the comparison between the total albedo proton spectra outside the SAA measured by HEPD-01 (blue), PAMELA [44] (red) and AMS-01 [17] (black) for two different magnetic latitude ranges – |Λ| < 0.2 (top panel) and 0.8 < |Λ| < 0.9 (bottom panel). It is important to report that these three measurements have been performed in different epochs: while HEPD-01 data-taking includes the intermediate phase between 24th and 25th solar cycles, PAMELA spectra refer to the period 2006–2009 – at the minimum of solar cycle 23rd – and AMS-01 in 1998 –during the early 23rd solar cycle. Furthermore, the orbits of PAMELA (∼350/∼600 km of altitude, ∼70◦ of inclination) and AMS-01 (∼350 km, ∼52◦ of inclination) were different from those of CSES-01. These facts may contribute to the agreement not being perfect (reaching a maximum of ∼35% at ∼80 MeV, the first data point of PAMELA), even if these albedo populations are expected to be rather stable over time. Errors in HEPD-01 spectra are a sum of both statistical and systematic uncertainties. Fig. 7 shows the time evolution of the albedo proton population
over the period 2018–2022, with a monthly resolution, measured by

Fig. 3. Distributions of lifetimes of albedo protons at magnetic latitudes lower than ∼30◦ as a function of the particle energy (left panel). Same distributions – at all latitudes – as a function of the product RL2 (right panel). The various families are well visible.
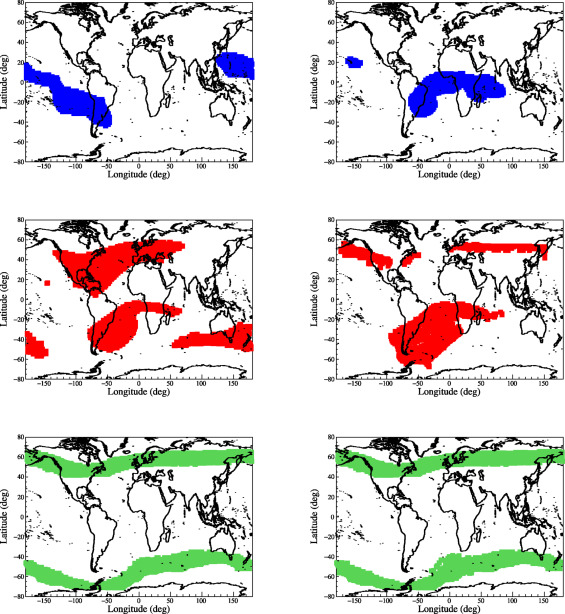
Fig. 4. Generation (left panels) and absorption (right panels) points for QT (upper panels, blue), UTS (middle panels, red) and UTL protons (bottom panels, green).
HEPD-01 between 40 and 100 MeV (black points) and between 100 and 200 MeV (red points). Panels, from top to bottom, refer to different intervals of L: 1.1-1.6 RE , 1.6-2.2 RE , and 2.2-3.2 RE . All profiles have been normalized to the month of August 2018, to highlight their general temporal stability. Even if in top and middle panels the albedo
protons are rather stable, in the third panel an increasing trend could be spotted — even if errors are larger, due to statistics. Probably at higher latitudes, the variability of the outer belts becomes more important, or
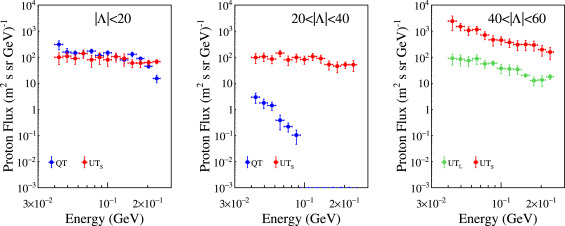
Fig. 5. Differential energy spectra for the three albedo proton populations (QT in blue, UTS in red and UTL in green), evaluated in three magnetic latitude intervals: |Λ| < 20 (left panel), 20 < |Λ| < 40 (middle panel) and 40 < |Λ| < 60 (right panel).
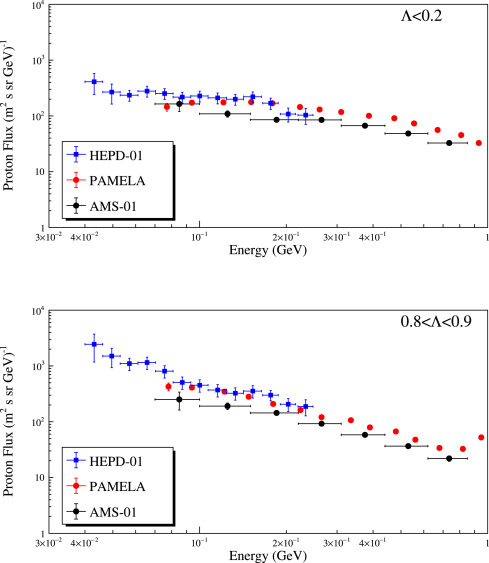
Fig. 6. Comparison between total albedo proton flux measured outside the SAA by HEPD-01 (blue), PAMELA (red) and AMS-01 (black) in two regions of magnetic latitude: Λ < 0.2 and 0.8 < Λ < 0.9 (top and bottom panels, respectively).
electron populations, which are more abundant in these regions, could contaminate the proton sample. In any case, albedo populations being a direct product of cosmic particles, are influenced by the changing solar modulation, even if in a more subtle way. It is important to stress the fact that, during the HEPD-01 data taking (2018–2022), the solar cycle was in a period of minimum, starting to rise towards the maximum only after mid-2020. This could explain the overall stable trend in the profiles shown in Fig. 7. However – as the maximum approaches –more geomagnetic storms and solar events will occur; the effect of these
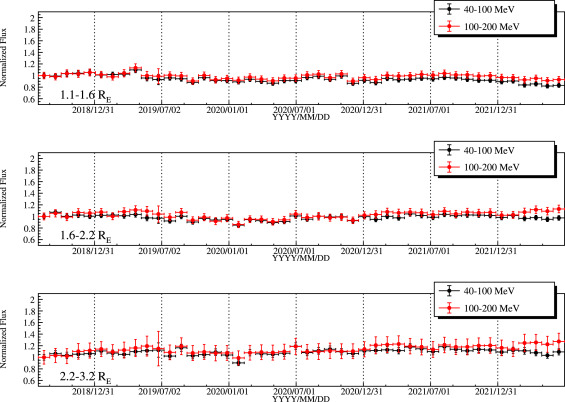
Fig. 7. Variation of the monthly total re-entrant albedo proton population in 2 energy intervals (40–100 MeV in black and 100–200 MeV in red) over 3 L intervals: 1.1-1.6 RE (top), 1.6-2.2 RE (middle) and 2.2-3.2 RE (bottom). Data are normalized to the month of August 2018, for better visualization.
phenomena on albedo populations (like the pitch-angle dependencies) could be of interest, so we will leave this for a future publication.
7. Conclusions
In this work, we presented the measurements made by the HEPD- 01 payload onboard the CSES-01 satellite of re-entrant albedo protons between ∼40 and ∼250 MeV, during the 2018–2022 period. A trajectory-tracing software was extensively used to simulate the motion of particles inside the Earth’s magnetosphere, allowing to classify the albedo component into three populations: quasi-trapped, precipitating, and pseudo-trapped, each one with its peculiar characteristics. These families populate different geomagnetic zones – including the penumbra region – and their different lifetimes contribute to defining their classification, as seen in Figs. 2 and 3. Quasi-trapped protons, for example, are confined in low-latitude regions, produced and absorbed near the Anomaly; on the contrary, short-lived albedo protons are spread more or less over the entire geographical extent, while long-lived ones bounce between northern and southern hemispheres, just below polar sectors — see Fig. 4. Consequently, albedo proton fluxes strongly vary along the orbit, as Fig. 5 suggests, but – overall – they are rather stable in time (Fig. 7). Such stability is observed during the four years of HEPD-01 data-taking and also relative to past experiments like PAMELA and AMS-01, as reported in Fig. 6. As a result, HEPD-01 proved very well-suited in precise measurements of proton populations under the rigidity cutoff, also following their evolution in time; this work completes the overall picture of the measurements of protons in the near-Earth environment during the intermediate phase between 24th and 25th solar cycles, adding up to what already published in [31] for trapped and in [29] for galactic protons.
Acknowledgments
The authors thank the reviewer for his/her careful reading of our manuscript and his/her many insightful comments/suggestions. This work makes use of data from the CSES mission, a project funded by China National Space Administration (CNSA), China Earthquake Administration (CEA) in collaboration with the Italian Space Agency (ASI), National Institute for Nuclear Physics (INFN), Institute for Applied Physics (IFAC-CNR), and Institute for Space Astrophysics and Planetology (INAF-IAPS). This work was supported by the Italian Space Agency in the framework of the ‘‘Accordo Attuativo 2020-32.HH.0 Limadou Scienza+’’ (CUP F19C20000110005), the ASI-INFN Agreement No. n.2014-037-R.0, addendum 2014-037-R-1-2017, and the ASI-INFN Agreement No. 2021-43-HH.0. This research has been carried out in the framework of the CAESAR (Comprehensive spAce wEather Studies for the ASPIS prototype Realization) project, supported by the Italian Space Agency and the National Institute of Astrophysics through the ASI-INAF n. 2020-35-HH.0 agreement for the development of the ASPIS (ASI SPace weather InfraStructure) prototype of scientific data centre for Space Weather. The authors finally acknowledge the members of the PAMELA Collaboration, for their advice and guidance in approaching the analysis reported in this paper.