Multispacecraft Observations of Protons and Helium Nuclei in Some Solar Energetic
Table of Contents
Abstract
The intricate behavior of particle acceleration and transport mechanisms complicates the overall efforts in formulating a comprehensive understanding of solar energetic particle (SEP) events; these efforts include observations of low-energy particles (from tens of keV to hundreds of MeV) by space-borne instruments and measurements by the ground-based neutron monitors of the secondary particles generated in the Earth atmosphere by SEPs in the GeV range. Numerous space-borne missions provided good data on the nature/characteristics of these solar particles in past solar cycles, but more recently—concurrently with the rise toward the maximum of solar cycle 25—the High-Energy Particle Detector (HEPD-01) proved to be well suited for the study of solar physics and space weather. Its nominal 30–300 MeV energy range for protons can enlarge the detection capabilities of solar particles at low Earth orbit, closer to the injection limit of many SEP events. In this work, we characterize three SEP events within the first six months of 2022 through spectral and velocity dispersion analysis, assessing the response of HEPD-01 to >M1 events.
1. Introduction
Many aspects of solar energetic particles (SEPs) are still rather poorly known, and new observations are necessary to shed more light on this topic. Among other things, understanding when such particles are injected into space is essential to gain knowledge on the acceleration and transport mechanisms involved. Determining their release time based on direct observations at 1 au has proven challenging because of numerous uncertainties like the estimation of the length and shape of the magnetic field line along which the particles propagate. Furthermore, factors like the conditions of interplanetary transport, the actual injection profile of particles (M. B. Kallenrode & G. Wibberenz 1990), as well as the angular distance between the flare site and the magnetic footpoint on the Sun’s surface (M. B. Kallenrode et al. 1993) complicate the overall picture. These difficulties are also worsened by instrumental deficiencies, like a higher background noise (mostly during the initial phase of the event), contamination, or a delayed response. To confront these challenges, numerous studies on solar particle onsets have been carried out in the past—see, for example, S. Kahler (1994), H. Debrunner et al. (1997), J. Torsti et al. (1998), T. Laitinen et al. (2000), G. C. Ho et al. (2003), R. A. Mewaldt et al. (2003), and S. Dalla et al. (2003) (and more recently, K. Huttunen-Heikinmaa et al. 2005; R. Vainio et al. 2006; A. Kouloumvakos et al. 2015; A. Kollhoff et al. 2021; F. Frassati et al. 2022; M. Martucci et al. 2023a; N. Dresing et al.2023). Usually, the dependencies of these onset times on particle species, the gradual/impulsive type of the SEP (S. W. Kahler et al. 1978; E. W. Cliver et al. 1982; S. W. Kahler et al. 1984; H. V. Cane et al. 1986; D. V. Reames 1999; D. Ruffolo 2002; M. Desai & J. Giacalone 2016), and the presence of electromagnetic radiation emitted by the Sun are the most explored characteristics.
For example, the timing of low-energy protons (up to ∼50 MeV) during some SEP events has been compared with that of 1–300 keV electrons, finding a simultaneous injection between them in some cases and a delay of up to 2 hr in others; see S. Krucker & R. P. Lin (2000). A delay was also measured by comparing helium nuclei and proton solar particle release (SPR) times in the 14–51 MeV n−1 energy range (K. Huttunen-Heikinmaa et al. 2005); in most cases, helium nuclei are released after protons. Ions with Z 6 (<88 MeV n−1) are found to be generally released later than 38315 keV electrons, with a delay close to 1 hr and a rather strong dependence on the 3He/4 He ratio (G. C. Ho et al. 2003; R. A. Mewaldt et al.2003). The dependence on the gradual/impulsive nature of SEPs was investigated in A. J. Tylka et al. (2003), comparing the arrival times of various particle species during two large impulsive events and three ground-level events. From all thesen analyses, it is found that the presence/absence of the delay is generally ascribed to differences in particle acceleration processes. A variety of information useful to understand SEP acceleration and transport can also be extracted from the spectral shape of the energetic particles emitted during solar events. Recent studies have investigated this topic—see, for example, A. J. Tylka et al. (2005), M. A. Dayeh et al. (2009), A. J. Tylka et al. (2010), A. P. Rouillard et al. (2011), R. A. Mewaldt et al.(2012), M. Laurenza et al. (2015), A. P. Rouillard et al. (2016), and S. W. Kahler et al. (2017). The consensus is now that SEPs are accelerated by both flares and shocks (originating from coronal mass ejections, CMEs), and some traces of these mechanisms are retained by particles registered at 1 au. However, disentangling the effects at play in these situations is difficult, and more complex scenarios have emerged (L. Kocharov & J. Torsti 2002). An extensive review on the topic can be found in M. Desai & J. Giacalone (2016), J. Zhang et al. (2021), and D. V. Reames (2021). In the last few years, the High-Energy Particle Detector (HEPD-01) on board the China Seismo-Electromagnetic Satellite (CSES) proved itself to be well-suited for solar particle studies. Its precision and its stability in time could be very important in studying rapidly changing phenomena like these, obtaining important information (both on arrival times and spectral shape) on MeV particles injected during SEPs. In this work, observations from HEPD-01 and other instruments for three SEP events that occurred during the first half of 2022 will be examined. The paper is organized as follows: a brief overview of the instrumentation is reported in Section 2, some insights on event selection and data sources are given in Section 3, the analysis technique for particle spectra and arrival times is presented in Section 4, results are given and discussed in Section 5, while conclusions are drawn in Section 6.
2. Instrumentation
Newer detectors such as HEPD-01 can contribute by bringing precise and stable measurements of solar particle populations during SEPs. As mentioned in Section 1, HEPD-01—fully developed and assembled in Italy as part of the Limadou branch of the CSES project—is a rather new addition to the network of spacecraft monitoring the near-Earth space. It serves as one of the nine devices on board the Chinese satellite CSES, launched in 2018 and put in a low Earth orbit at ∼500 km. The detector is a lightweight and compact payload, optimized to measure electrons in the 3–100 MeV energy range and protons with kinetic energy between 30 and 300 MeV, as well as light nuclei. The HEPD-01 capabilities in galactic, trapped, and solar proton measurements have already been shown in S. Bartocci et al. (2020), M. Martucci et al. (2023a, 2023b), and M. Martucci et al. (2022). Furthermore, observations of variations of low-energy populations inside the Earth’s magnetosphere during geomagnetic storms can be found in F. Palma et al. (2021) and M. Piersanti et al. (2022). More technical details on the mission, the detector, and data preparation are reported in P. Picozza et al. (2019).HEPD-01 fluxes are calculated from scratch starting from level 2 data by the CSES/Limadou collaboration (data calibrated up to 2022 July). The selection criteria for flux calculations in HEPD- 01 are described in detail in S. Bartocci et al. (2020), and only a brief overview will be given here. Since the payload is built around a stack of plastic scintillators (TOWER) and a matrix of lutetium–yttrium oxyorthosilicate (LYSO) crystals, measurements are of calorimetric nature; this means that only particles fully contained in the detector are considered to be valid. A system of VETO planes
surrounding the payload ensures this containment. The two upper layers of the TOWER (together with the information given by the trigger plane) provide the signal to start the acquisition process. The geometrical factor, efficiency, and systematics are all calculated using dedicated GEANT4 simulations. Regarding the geomagnetic selection applied to discriminate between protons coming from outside the magnetosphere (like solar particles) and particles trapped inside, we use a static rigidity cutoff map obtained using a dedicated simulation with the Tsyganenko 96 magneto-spheric model (N. A. Tsyganenko 1995) and with the external magnetic field input parameters corresponding to the quiet period around the strong GLE event of 2021 October 28. In fact, at HEPD-01 energies, no heavy modification of the magnetic field lines configuration is registered at these latitudes during the three events under study. Nevertheless, a 30% uncertainty on the value of the cutoff was applied to be sure to cut down contamination from reentrant or trapped proton components (as small as it can be if compared with SEP fluxes) or to take into account any possible change in the cutoff map. Although HEPD-01 is switched off before entering the polar caps (above ± 70°), the ∼60° aperture of the instrument allows for rather good statistics to galactic and solar protons. To build a larger and more complete picture of the properties of the selected SEP events, HEPD-01 measurements are complemented by those from other instruments, all operational and with publicly available data on the OMNI WEB website (https://omniweb.gsfc.nasa.gov/ftpbrowser/flux_spectr_m.html) or directly on the mission website. The Ultra Low Energy Isotope Spectrometer (ULEIS) instrument (G. M. Mason et al. 1998), one of the scientific payloads of the ACE spacecraft (E. C. Stone et al. 1998), measures protons (0.160–7.3 MeV n−1) and helium nuclei (0.06–8.7 MeV n−1). The Electron Proton Helium INstrumentn(EPHIN; R. Muller-Mellin et al. 1995) and the Energetic and Relativistic Nuclei and Electron (ERNE; J. Torsti et al. 1995) detectors—both on board the Solar and Heliospheric Observatory (SOHO) spacecraft (R. Muller-Mellin et al. 1995)—can measure protons and helium nuclei in the 4.3–53 MeV n−1 energy range (EPHIN) and in the 1.3–130 MeV n−1 energy range (ERNE). The Energetic Particle Acceleration, Composition, and Transport (EPACT) instrument (T. T. von Rosenvinge et al. 1995) on board the WIND spacecraft (R. Harten & K. Clark 1995) is able to detect Z = 2 nuclei between 2 and 9.6 MeV n−1. All these instruments, mostly active for at least
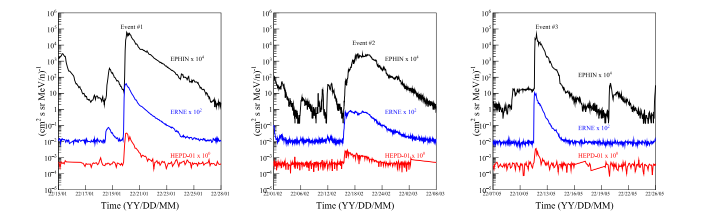
Figure 1. Time profiles of energetic protons of the three SEPs under study. Hourly proton data are a composition of SOHO/EPHIN 4.3–7.8 MeV (black), SOHO/BERNE 40–50 MeV (blue), and HEPD-01 80–90 MeV (red). Note the time extension in the central panel: the time extent of event 2 is larger than the other two.
20 yr, are located around the Lagrangian point L1, allowing for direct exploration of the Sun–Earth environment. We used data with a time resolution of 1 hr to avoid issues related to instabilities and statistics.
3. Event Selection
In the period 2018–2022, 10 X-class and >90 M-class flares occurred. In our study, we quantitatively compare some of these events, highlighting some of their properties and testing the response of the HEPD-01 detector to small (M-class) solar events. To have the clearest picture possible, we have to face some limitations and constraints in selecting good candidates to analyze:
1. The SEP must have a fair energy extension to be registered by at least two energy channels of HEPD-01.
2. Each SEP must take place over a quiet period, i.e., SEP events must be separate in time with no significative overlapping; this excludes many SEPs, including many of the largest ones.
3. HEPD-01 and other instruments must be all operational during the entire period, without holes in the data or major saturation.
These criteria (even if the first one is the most constraining) restrict our search to only three SEP events; hereafter, they will be referred to by numbers 1, 2, and 3, for convenience. The time profiles for each of these SEPs are shown in the three panels of Figure 1. The hourly proton data—scaled for clarity are a composition of SOHO/EPHIN 4.3–7.8 MeV (black), SOHO/ERNE 40–50 MeV (blue), and HEPD-01 80–90 MeV (red). An energy dependence is evident by comparing low-energy profiles with high-energy ones. Although the sample is narrow, the three events present some important features regarding their source and the characteristics of the CME, etc., which are summarized below:
1. Event 1: Sunspot AR2929 (N07W86) erupted on 2022 January 20 at 05:41 UTC, producing a M5.5-class solar flare. A fast (∼1400 km s−1), partial-halo CME with an angular extension of ∼210° was produced at 06:12 UTC, and a significative type-II radio burst was registered between 06:02 UTC and 06:41 UTC.
2. Event 2: The source for this event is probably a fast-halo CME emitted by the Sun on 2022 February 15—from far behind the east limb—at 22:12 UTC (∼1900 km s−1, ∼360°). The associated particle event was extremely long, with a duration of more than 10 days at ∼50 MeV.
3. Event 3: Sunspot AR3007 (S22E31) erupted on 2022 May 11, producing two flares—a M1.6 at 16:35 UTC and a M2.3 at 19:27 UTC. Furthermore, a long-lasting M2.7 class flare (which we believe is the source of the SEP in the third panel of Figure 1) occurred at 18:13 UTC from the AR3004, just across the western limb (S17W99). A fast (>1000 km s−1) CME with angular width of ∼200° was produced at 18:36 UTC. Finally, a type-II emission was registered for this event.
It is important to note that, while event 1 and 3 are western events, event 2 is an eastern one; this could be inferred by looking at the central panel in Figure 1, where the time profile of solar particles is rather different from the profiles of the other two. Thus, some differences (i.e., arrival time and propagation, etc) are expected. Usually, SEP events extending well over the hundreds-of-MeV threshold are related to strong solar flares, like the X1.0-class event that occurred in 2021 October; see M. K. Georgoulis et al. (2019), A. L. Mishev et al. (2022), and M. Martucci et al. (2023a). On the other hand, events linked to M-class phenomena are limited in energy.
4. Analysis
This section is organized into two parts: In the first one, the technique for the evaluation of the energy-extended, time integrated pure solar spectra for the three SEPs described previously is outlined. In the second one, the steps for analyzing velocity dispersion at the onsets of the events are explained.
4.1. Spectral Analysis and Fit
In order to obtain a wide energy, pure solar fluence19 spectrum, HEPD-01 alone is not sufficient; measurements from different detectors are required (see Section 2). It is important to note that, in this analysis, issues related to the different locations of the single instruments, the experimental techniques in play, and the presence of contamination/saturation may intervene. From a procedural point of view, the SEP intensities

Figure 2. The event-integrated, pure solar fluence spectra of H and He for events 1, 2, and 3 as a function of kinetic energy per nucleon—panels (a). The ratio between H and He is shown in panels (b) of each plot, together with a reference value from D. V. Reames (1995; magenta square). Fits with both Ellison–Ramaty and Weibull functions are superimposed to the points (solid and dashed blue lines, respectively).
measured in each energy bin with 1H resolution are summed up over the entire event duration, and the time-integration interval is computed by identifying the temporal “limits” of a single event looking at their profiles. For the purpose of the spectral analysis, an event is considered started if the intensity/background ratio is greater than 5 and is considered finished if the intensity profile returns to the pre-SEP condition. None of the events in this work shows a Forbush decrease (S. E. Forbush 1937), so the background before the SEP event is not overestimated compared to the one after. This procedure was already employed by R. A. Mewaldt et al. (2005), A. Bruno et al. (2019), and M. Martucci et al (2023a).
Now that an SEP spectrum is built, a pure solar fluence must be extracted; so, a quiet galactic cosmic-ray (GCR) spectrum, evaluated in a suitable period, must be estimated to subtract it from the total (solar+galactic) fluence. All investigated events took place during the time span of the first ∼5 months of 2022, so a quiet GCR background evaluated during 2021 December seems a viable choice since no major SEP events occurred in this month. To account for possible errors related to this procedure, a systematic uncertainty of ∼30% is associated to all data points. It is important to note that, usually, the construction of these time-integrated energy spectra involves high-energy data from GOES, as reported, for example, in R. A. Mewaldt et al. (2005) and A. Bruno et al. (2019). However, GOES data are affected by significant uncertainties related, among other things, to high contamination by out-of-acceptance particles and high GCR background (A. Bruno 2017). In order to further characterize these spectra, we fit them with two spectral shapes. In D. C. Ellison & R. Ramaty (1985) it has been proposed that the solar particle spectra accelerated by shocks could be described by a function (Ellison–Ramaty) of the form
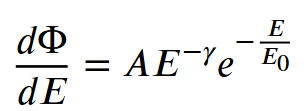
where Φ is the intensity or fluence, E is the kinetic energy (MeV n−1), and A, E0, and γ are constants—amplitude, rollover energy, and spectral index, respectively. This spectral shape has been found to fit numerous SEP events in the past; see, for example, A. J. Tylka et al. (2001). Furthermore, all spectra are fitted with a Weibull distribution (U. Frisch & D. Sornette 1997; M. A. Xapsos et al. 2000; M.-H. Y. Kim et al. 2007; M. Laurenza et al. 2015, 2016; G. Pallocchia et al. 2017), also known as the two-parameter stretched exponential.The corresponding function has the form
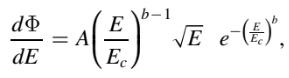
where b is a spectral index, Ec is a characteristic energy, and A is a scaling factor, as discussed in G. Pallocchia et al. (2017). The results of both these fits, together with the physical implications, will be given in Section 5.
4.2. Velocity Dispersion Analysis
We wish to examine the release times of energetic particles at the Sun (the SPR time) and, to do so, follow the methodology of K. Huttunen-Heikinmaa et al. (2005) and Z. Xu et al. (2020). To determine the onset times at 1 au, the Poisson–cumulative sum (CUSUM; J. M. Lucas 1985) method is employed. CUSUM quality-control, statistical schemes are largely applied in fields like industry and science, being designed to give the earliest warning possible of a change in a certain process with respect to a steady, preexisting condition (E. S. Page 1954). The detection of solar injection over the quiet galactic background is a good representation of this procedure. For each energy channel of a detector, we collect the earliest arrival time or onset of solar particles—as seen as an increase over the pre-SEP state. As stated in the literature (S. Krucker et al. 1999; R. A. Mewaldt et al. 2003; A. J. Tylka et al. 2003; K. Huttunen-Heikinmaa et al. 2005; Z. Xu et al. 2020), the basic assumptions for the velocity dispersion analysis (VDA) to be applied are that all particles
travel the same distance (path length) to the observer and that particles of all energies and speeds are released at the same time, which may not be the same for different species. In this way, the arrival time at the observer will only depend inversely on the particle speed v. So, extrapolating the onset times as a function of 1/v to 1/v = 0 gives the inferred release time (8SPR), and the slope of the line gives the path length. The results of this procedure will be reported in Section 5.
5. Results and Discussion
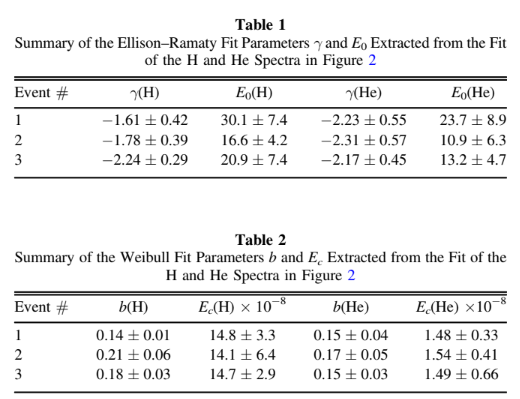
The event-integrated, pure solar fluence spectra of protons (H) and helium nuclei (He) for events 1, 2, and 3 are shown in panels (a) of Figure 2 as a function of kinetic energy per nucleon. In panels (b), a ratio between H and He is shown. It is worth noting that seemingly all of the spectra have a power-law component at energies lower than a few MeV n−1, with a significant steepening in the interval from 10 to 20 MeV n−1 upward. This is consistent with the spectra of other events in the literature; see J. E. Mazur et al. (1992), A. J. Tylka et al. (2005), and R. A. Mewaldt et al. (2005). Events 1 and 2 (first two panels) present differences in shape between the H and He spectra, whereas for event 3, H and He spectra look more similar. Some small deviations from a pure power law can be seen in ACE/ULEIS data, especially for event 3. Each spectrum in Figure 2 is fitted with Ellison–Ramaty (solid blue line) and Weibull (dashed blue line) functions. Although the first one seems to reproduce the spectra reasonably well, the Weibull distribution presents a better reduced χ2 for events 1–3, and it adapts to the break at higher energies and the lower portion of the spectra. In any case, even if the number of events available is limited, we do not find any event in which the spectrum dramatically deviates from the Ellison–Ramaty functional form, even if this is not uncommon (J. E. Mazur et al. 1992). In the past, spectral breaks E0 in SEP events have been shown to be well approximated by the charge-to-mass ratio of the particle species, in the form E0 ∝ (Z/M)dn, where d is closer to 1 evennin rarer cases d ∼ 2 (A. J. Tylka et al. 2005; R. A. Mewaldt et al. 2005). Table 1 reports the parameters of the Ellison–Ramaty fit for the three events under study. In these three events, the E0(H)/E0(He) values are between 1.3 and 1.6, as expected if d ∼ 1. On the other hand, Table 2 reports the parameters extracted from the Weibull fit.
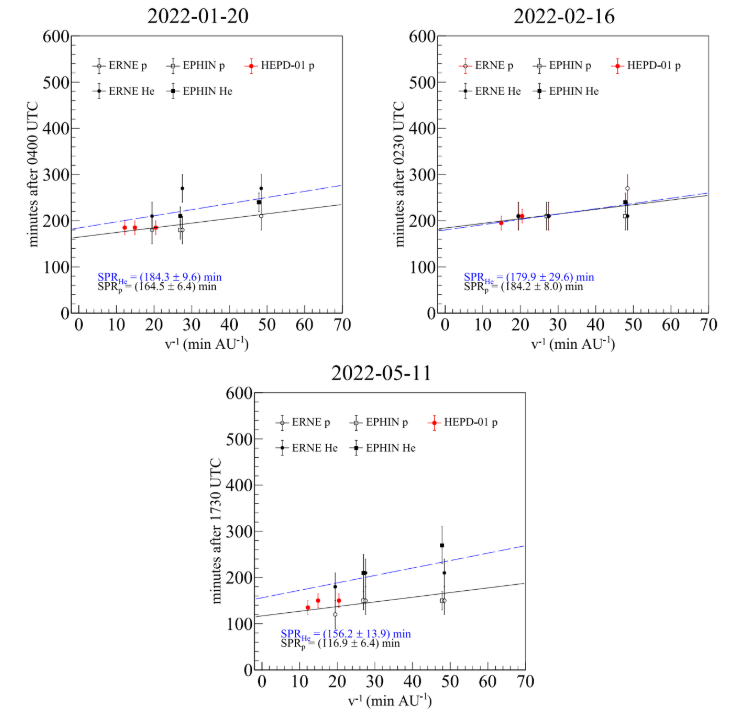
Figure 3. Velocity dispersion plots for H and He. Data from various experiments—see the legend—are illustrated together with the linear fit and relative SPR parameters for both species.
Events 1–3 can be seen to have compatible values for b and Ec, which is interesting since events 1 and 3 are western, while event 2 is far eastern and with a greater duration in time; from these characteristics, some differences in propagation effects would have been expected. The H/He ratio is shown as a function of energy in the bottom panels of Figure 2, together with the ratios resulting from fits to the spectra using the Ellison–Ramaty and Weibull functions. Magenta squares in the panels refer to the average value found in D. V. Reames (1995). These ratios vary greatly with energy, and therefore, the abundances are strongly energy-dependent. In particular, between ∼0.1 and ∼100 MeV n−1 H/He spans 2 and 3 orders of magnitude. However, this is something expected; see, for example, J. E. Mazur et al. (1993) and R. A. Mewaldt et al. (2005), where a H/He variation up to 50 is found in many analyzed SEPs during the period of 2003 October–November. It is important to note that only in event 1 the agreement with the average reported in D. V. Reames (1995) at a value close to ∼27.5 is rather good; events 2 and 3 show a quite large discrepancy, as also found in R. A. Mewaldt et al. (2005), where the agreement is good only for one of the five SEPs analyzed there. Despite the He data points from the EPACT detector, which seem to be always underestimated,20 the H/He ratio obtained from the fit with Weibull—dashed blue line—is
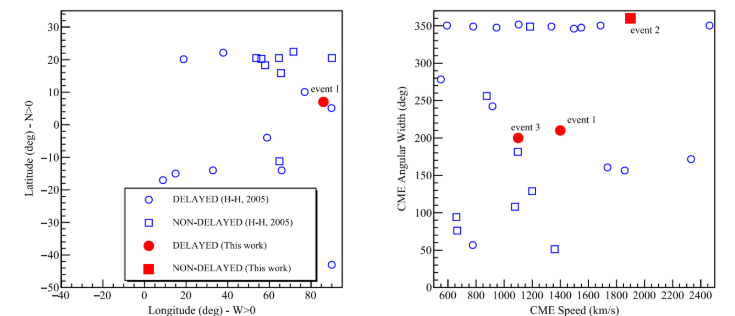
Figure 4. Locations of flares (left) and CME angular width/speed (right) related to delayed and nondelayed front-side events taken from R. A. Mewaldt et al. (2005; blue markers) and from this work (red markers). The legend is shared by both panels. Red points for events 2 and 3 in the left panel are absent because the location is unknown or located behind the limb.
more consistent with the data than the one resulting from Ellison-Ramaty—solid blue line; this is particularly noticeable in event 3 at energies <5 MeV n−1. Concerning the arrival of solar particles, the inverse velocity versus particle onset time for H and He are reported in Figure 3, together with the linear fit for both species (solid black line for H and dashed blue line for He). The SPR times are shown in the bottom right corner of each plot. The extracted path length values never exceed 2 au, with an average value of 1.34 ± 0.42 au between H and He, in agreement with Figure 5 in K. Huttunen-Heikinmaa et al. (2005). For the SPR times we have:
1. Event 1: Protons are released 164.5 ± 6.4 minutes after 04:00 UTC (∼06:44 UTC), while Helium is released 184.3 ± 9.6 minutes after 04:00 UTC (∼07:04 UTC). The delay between H and He is 19.8 ± 9.7 minutes.
2. Event 2: Protons are released 184.2 ± 8.0 minutes after 02:30 UTC (∼05:34 UTC), while Helium is released 179.9 ± 29.6 minutes after 02:30 UTC (∼05:29 UTC). The delay between H and He is -4.3 ± 30.7 minutes.
3. Event 3: Protons are released 116.9 ± 6.4 minutes after 17:30 UTC (∼19:27 UTC), while Helium is released 156.2 ± 13.9 minutes after 17:30 UTC (∼20:06 UTC).The delay between H and He is 39.3 ± 14.0 minutes.
Given the plethora of uncertainties and effects caused by the source location, particle injection profiles, conditions in interplanetary space during propagation, and the difficulty in disentangling all the mechanisms governing particle acceleration during SEPs, we can say that a general delay between the release time of He with respect to H is present for events 1 and 3, while event 2 can be considered as “nondelayed” given the greater error on the SPRHe parameter. This is somewhat expected; it was an event with a very slow rise to the maximum and a consequently unclear definition of onset times. Moreover, uncertainties on this event involve the source on the Sun, probably far behind the eastern limb. Following K. Huttunen-Heikinmaa et al. (2005), we correlate the most probable site of the solar flare (discussed in Section 3) on the Sun with the delay/nondelay in SEP arrival and also to the angular width and speed of the CME causing the enhancement: this can be seen in the left and right panel of Figure 4, respectively. Blue markers refer to the SEP events between 1996 and 2001 reported in K. Huttunen-Heikinmaa et al. (2005), while red ones refer to the three SEP events of this work. Data points for events 2 and 3 in the left panel are absent because the flare site is unknown or located behind the limb. Event 1 seems to be in agreement with the results obtained in K. Huttunen-Heikinmaa et al. (2005), since it falls in the same sectors of the original plot. On the contrary, events 2 and 3 (in the right panel) seemingly show some discrepancies.
6. Conclusions
In this work, we quantitatively characterized three SEP events within the first six months of 2022 through spectral and velocity dispersion analyses, meanwhile assessing the role of HEPD-01 for the study of SEPs from medium-sized (M1-M6) solar flares. The event-integrated, pure solar fluence spectra of H and He for these events—together with the H/He ratio—are shown in Figure 2; Ellison–Ramaty and Weibull fits for each particle species and for the H/He ratio are reported as well. All of the spectra present a power-law component at energies lower than a few MeV n−1, with a significant steepening in the interval from 10 to 20 MeV n−1 upward, as expected. The Weibull fit seems to reproduce the spectra reasonably better, following the break in the spectra at higher energies and the low-energy portion; Tables 1 and 2 report the parameters extracted from these fits. In particular, spectral breaks (E0) from the Ellison–Ramaty fit are well approximated by the charge-to-mass ratio of the particle species, in the form E0 ∝ (Z/M)d,where d = 1 in our case. Regarding the H/He ratio, it appears that it is strongly dependent on energy in the range between ∼0.1 and ∼100 MeV n−1, covering 2/3 orders of magnitude. However, the agreement with the average value found in D. V. Reames (1995) is good only for event 1, while the discrepancy increases for events 2 and 3. On this topic, we would like to note that, even for a few data points above ∼50 MeV, HEPD-01 observations are in good agreement with the ones from other experiments in this energy range, even if the plots span many orders of magnitude. Furthermore, we evaluated the arrival times of H and He at Earth, inferring the release time (SPR) at the Sun using a classical velocity dispersion analysis with a Poisson–CUSUM approach; data and results are shown in Figure 3. Despite the multitude of effects that may lead to an abundance of uncertainties—last but not least the relative weakness of the events under study—we assess that H are released before He for events 1 and 3 (delayed events), while event 2 is consistent with zero delay but the error on the SPRHe in large. From this work, it seems that the role of HEPD-01 in SEP studies could be of some importance, since it can cover an energy range that not many detectors can reach and also could validate some of the measurements of other instruments. HEPD-01 can not only provide measurements of strong solar events (M. Martucci et al. 2023a) but also medium-sized events (such as those often associated with M-class flares) that nevertheless exceed the GCR background in the instrument. This, in turn, can be very important in better defining the E0 parameter, for example. It is also important to stress the fact that, in late 2024, HEPD-02 (U. Savino 2024) will be launched on board the new CSES satellite with a complementary ground track with respect to the first one (identical orbit plane and 180° phase difference). Increased energy and angular resolutions, a novel detection technique, and the possibility to detect particles over polar caps guarantee high observational capabilities. So, there will be two payloads with the capability to detect electrons, protons, and light nuclei in the MeV energy range toward the maximum of solar activity of cycle 25 and for years to come.
Acknowledgments
This work makes use of data from the CSES mission, a project funded by China National Space Administration (CNSA), China Earthquake Administration (CEA) in collaboration with the Italian Space Agency (ASI), National Institute for Nuclear Physics (INFN), Institute for Applied Physics (IFAC-CNR), and Institute for Space Astrophysics and Planetology (INAF-IAPS). This work was supported by the Italian Space Agency in the framework of the “Accordo Attuativo 2020-32.HH.0 Limadou Scienza+” (CUP F19C20000110005), the ASI-INFN Agreement No. n.2014-037-R.0, addendum 2014-037-R-1-2017, and the ASI-INFN Agreement No. 2021-43-HH.0. This research has been carried out in the framework of the CAESAR (Comprehensive spAce wEather Studies for the ASPIS prototype Realization) project, supported by the Italian Space Agency and the National Institute of Astrophysics through the ASI-INAF n.2020-35-HH.0 agreement for the development of the ASPIS (ASI SPace weather InfraStructure) prototype of scientific data center for space weather.