The Catalogue of Gamma-Ray Burst Observations by HEPD-01 in the 0.3–50 MeV Energy Range
Table of Contents
Abstract
The High-Energy Particle Detector (HEPD-01) on board the China Seismo-Electromagnetic Satellite, located on a Sun-synchronous orbit at 500 km of altitude with an inclination of 97°, features a dedicated logic counting low-energy event rates, which proved sensitive to intense Gamma-Ray Burst (GRB). The present work reports a comprehensive analysis of signals induced by GRBs in the event-rate data collected between 2018 August and 2022 June. After accurately modeling the background rate as observed in different passages of the satellite over the same geographical area, we detected significant deviations to be compared with observations of GRB candidates from other observatories. The analysis revealed 12 statistically significant excesses, that have been associated with GRB 181222B, GRB 190114C, GRB 190129B, GRB 190305A, GRB 190928A, GRB 200412B, GRB 200422A, GRB 200826B, GRB 201009A, GRB 210702A, GRB 211211A, and GRB 220624A. We report light curves for 0.3–50 MeV photons, comparing them with findings from other space telescopes. The catalog of observations is published, complete of GRB observation time, duration, integrated counts, and fluence.
Introduction
Gamma-Ray Bursts (GRBs) are among the most luminous electromagnetic events occurring in the cosmos and are associated with extreme energy releases during catastrophic events such as supernovae, the merger of binary star systems, neutron stars, or black holes (T. Piran 2005). First identified incidentally in the late 1960s by the Vela satellites (R. W. Klebesadel et al. 1973), initially designed by the U.S. Air Force to monitor nuclear testing by the Soviet Union, GRBs are still considered significant phenomena of high-energy astrophysics, and their observations are still used to validate theories and models, offering unique insights into the physics of the universe under extreme conditions. GRBs are usually divided into two main categories based on their duration: long GRBs and short GRBs (C. Kouveliotou et al. 1993; A. Levan et al. 2016). The former category, which lasts more than two seconds, is generally associated with the collapse of massive stars in supernova events (T. J. Moriya et al. 2020). These bursts often occur in regions of active star formation. On the other hand, most events in the latter class last less than two seconds and are thought to be caused by the merger of massive and compact objects such as neutron stars or black holes (R. Perna et al. 2016). The distinction between these two categories is justified by both observational data and theoretical models (A. Levan et al. 2016). Besides their time duration, differences between the two kinds of GRBs concern their energy distribution, as a consequence of different energy release mechanisms. During the last decades, several instruments devoted to the observation of cosmic gamma radiation have been constructed and launched. Advancements in observational capabilities have rapidly increased in time, in parallel with the theoretical understanding of physics underlying GRBs. A list of the main active GRB observatories during the period between 2018 August and 2022 June, whose measurements are considered in this paper, is the following: on board the Fermi spacecraft, the Gamma-Ray Space Telescope, which hosts the Gamma-ray Burst Monitor (GBM) that covers an energy range from 150 keV to 30 MeV and provides data on GRB arrival time T0, duration, and energy spectrum (C. Meegan et al. 2009), and the Large Area Telescope operative in the energy range 20 MeV– 300 GeV (W. B. Atwood et al. 2009); on board the Swift Observatory, the Burst Alert Telescope (BAT) detects GRBs in the 15–150 keV energy range, having a noncoded response up to 500 keV (S. Barthelmy et al. 2005); on the Wind spacecraft, the Konus-Wind instrument that measures GRB emission in the 20 keV–20 MeV range and is able to provide data on GRB temporal and spectral properties (R. L. Aptekar et al. 1995); the INTEGRAL (International Gamma-Ray Astrophysics Laboratory) spacecraft (C. Winkler et al. 2003), with its high angular and time resolution IBIS/IBAS detection systems (P. Ubertini et al. 2003; S. Mereghetti et al. 2003), the high time resolution PICSIT detector and the all-sky monitor spectrometer on INTEGRAL SPI Anti-Coincidence Shield (SPI-ACS), with a detection threshold for GRBs of 80 KeV (A. von Kienlin et al. 2003). Last, AstroSat’s Cadmium Zinc Telluride Imager (CZTI), which detects photons with energy in the 10–150 keV range and provides data on the polarization of GRBs (T. Chattopadhyay et al. 2014). Several additional instruments like HXMT (S.-N. Zhang et al. 2020) and CALET (Y. Asaoka et al. 2019), with different detection capabilities, are active in the considered time span, but their observations are not considered in this work. In this context, the High-Energy Particle Detector (HEPD-01) hosted on the China Seismo-Electromagnetic Satellite (CSES-01; P. Picozza et al. 2019) represents a relatively novel addition to the list above. Launched on 2018 February 2, it is now flying on a Sun-synchronous orbit at an altitude of about 500 km. The main scientific goals of CSES-01 are the monitoring of electromagnetic phenomena related to seismic activity, the measurement of low-energy cosmic rays (S. Bartocci et al. 2020; M. Martucci et al. 2023a, 2024) and particles trapped by the geomagnetic field, and the observation of space weather phenomena such as solar flares (M. Martucci et al. 2023b) and geomagnetic storms (F. Palma et al. 2021). However, the HEPD- 01 instrument has proven invaluable in observing cosmic phenomena, particularly GRBs (F. Palma et al. 2023). Indeed, HEPD-01, equipped with a sophisticated data acquisition system (A. Sotgiu et al. 2021) and advanced event reconstruction capabilities (S. Bartocci et al. 2022), can detect high-energy particles and photons in a wide energy range. Other instruments on board CSES-01 are also capable to observe strong GRB events, such as the high-energy particle package-low-energy (HEPP-L), which detected the “BOAT” GRB 221009 (R. Battiston et al. 2023). Specifically, HEPP-L, acharged particle detector, measured a sudden change in the electron flux correlated with GRB 221009A, matching the photon flux at about 13:20 UTC on 2022 October 9. Simulations suggest that the change in flux was mostly due to electrons generated by the activation of the aluminum shield of the collimators. Indeed, the production of secondary electrons in passive structures is one of the mechanisms that can generate a signal detectable by HEPD-01 as a response to a GRB. In this work, we present the identification of GRBs out of the whole set of available HEPD-01 data, significantly expanding the number of the previous observations by the same instrument. By relying on a new analysis technique we identify 12 GRB events from 2018 August to 2022 June, each confirmed a posteriori by temporal coincidence and shape comparison with data stemming from established GRB observatories like Fermi and Swift. This analysis, based on a temporally and spatially adjusted statistical modeling of background rates, is also discussed. The aim of this paper is to present a comprehensive analysis of GRB detections by HEPD-01 on CSES-01, identified as significant anomalies in event rate data occurred in the time span from 2018 August to 2022 June, and to correlate these anomalies with known GRB events in order to assemble the complete version of the HEPD-01 GRB catalog. These observations contribute to the consolidation of GRB detections by other instruments, especially in the high-energy range above 0.3 MeV.
Performance of HEPD-01 in Detecting Gamma-Ray Burst
HEPD-01 was designed and optimized to detect protons within the energy range 30–250 MeV and electrons within the energy range of 3–100 MeV. More details about the detector characteristics and design can be found in G. Ambrosi et al (2018, 2020, 2021). Although HEPD-01 was primarily designed for detecting charged particles like protons and electrons, it has shown a noteworthy capability in observing GRBs. In HEPD-01 aboard the CSES-01 satellite, the data acquisition logic allows to record event rates by means of eight different triggers up to a maximum rate of 65 kHz (A. Sotgiu et al. 2021), thus enabling sensitivity to events of different nature, like intense GRBs. Each second, the data acquisition system of HEPD-01 records event rates across all trigger masks, regardless of the primary configuration set for full data acquisition. This feature enables HEPD-01 to help monitoring space weather and studying cosmic phenomena. For an event to be considered valid, the trigger masks check which subdetectors within HEPD-01 register a signal. The simplest trigger condition, labeled as T, requires solely an above-threshold signal in the trigger plane, setting the lowest energy threshold at about 3 MeV for electrons and 10 MeV for protons (F. Palma et al. 2021). More complex conditions require the coincidence between additional scintillators, resulting in a negligible efficiency in GRB detection. The recorded rate at a 1 s time resolution for the T trigger mask make up the signal considered in the present work. By opting for T configuration, the detector can enhance its sensitivity to secondary particles like electrons and positrons, which are produced by interactions between gamma photons and the detector material. Such configuration allows HEPD-01 to detect GRBs despite its being primarily designed for charged particle detection. The result of a Monte Carlo simulation of the effective area of HEPD-01 for photon detection in the T trigger configuration is shown in Figure 1. The effective area is plotted as a function of the energy of the incoming photon and for different incidence angles. The effective area for on-axis (0°) photons shows an energy range from 300 keV to 50 MeV, with a peak efficiency at about 1–2 MeV. The actual on-axis effective area measures approxi- mately 12 cm2 at lower energy and about 8 cm2 at higher energy. As the incidence angle increases from 0° to 90°, the effective area changes. At low incidence angles, the reduction in the trigger area projection (∝cos q) is balanced by the
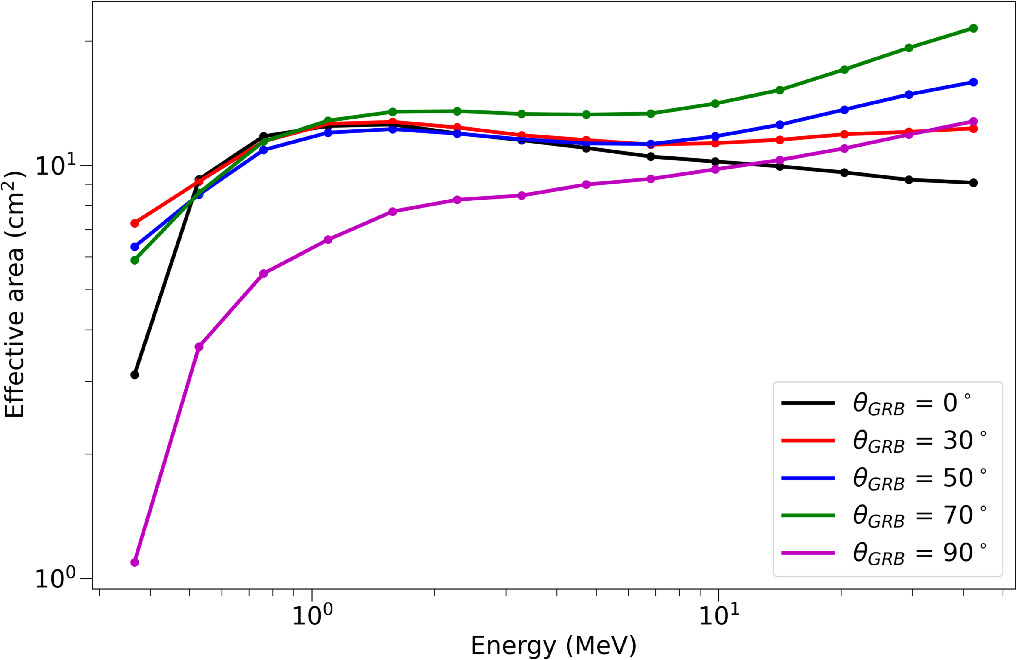
Figure 1. The figure shows a comparison of the effective area of the detector at different incident angles using the HEPD-01 Monte Carlo simulation. The effective area (in cm2 ) is plotted as a function of energy (in MeV) for five different angles of incidence: 0° (black), 30° (red), 50° (blue), 70° (green), and 90° (magenta). Each data point represents the measured effective area at a specific energy.
increased path length of the photons (∝1 cos q), which enhances the interaction probability. However, for lateral configurations, photons can be blocked by structural elements (absent on the top of HEPD-01), resulting in a suppressed effective area, particularly at low energies.
Statistical Analysis for Anomalies Detection
The events studied in the present work correspond to anomalies identified in the HEPD-01 data by means of a newly implemented tool for outlier detection. This tool was designed to model the background rate in an adaptive way according to the satellite position and when the measurement was carried out. The approach exploits data collected in multiple passages of the satellite over the same geographical area to infer the parameters of a polynomial that optimally fits the typical background rate within a given time window. An anomaly, or outlier, is then identified according to statistically significant deviations of the rate with respect to the modeled background.
3.1. Outlier Search Algorithm Description
The outlier detection algorithm analyzes the rate time series in sliding windows having a duration of 60 s, each shifted by 15 s with respect to the previous one. Each window corresponds to a segment of the satellite orbit encompassing an arc of ∼3.8°. Given a window, whose starting time is henceforth referred to as t0, the first step of the algorithm consists in modeling the typical background shape for that window’s geographical position and time. To this purpose, the algorithm examines data between 16 days before and 16 days after t0, searching for orbit segments that are spatially closest to the geographical location of the window under test. Because the recurrence time of the satellite over the same geographical location is approximately 5 days, the search is optimized by considering time intervals of 30 minutes around the time points t0 ± 5 · K · 86,400 s, where K ä {1, 2, 3}. A diagram of the search algorithm is reported in Figure 2. Within each time interval of 30 minutes (green segments of Figure 2), successive “background” windows are ranked according to an averaged point-to-point Euclidean distance
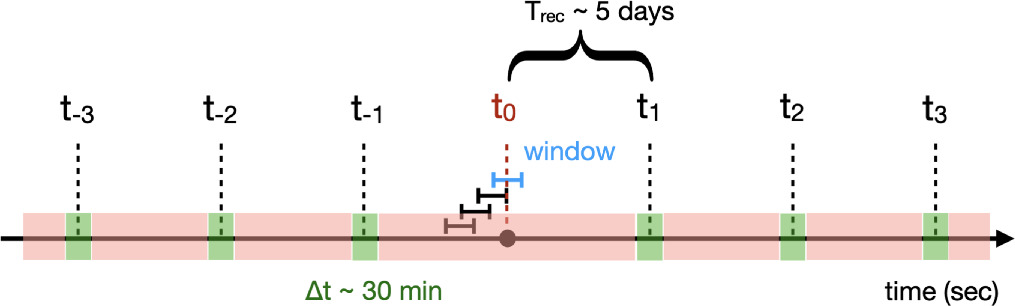
Figure 2. Diagram of the method used to collect data from similar orbits, in order to determine typical background fluctuations and shapes. Overlapping windows, each having a duration of 60 s, are depicted in the middle, each shifted by 15 s. A specific test window at time t0 is highlighted in blue. A time span of approximately 5 days and corresponding to the satellite’s recurrence time is highlighted. The time intervals of ±30 minutes around the times t0 ± 5 × K × 86,400, with K ranging from 1 to 3 (three on the right and three on the left), and which are considered to assess background data, are highlighted in green. Data outside these regions (light-red area) are neglected. The final selection, which relies on geographical distance, yields a single orbit segment within each green time frame.
calculated as follows:
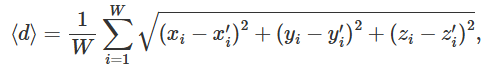
where W = 60 is the window size, the triplet (x, y, z) is the position of the satellite in the window under test, whereas the triplet (xyz ) is the position of the satellite in each one of the considered background windows. The background window corresponding to the minimum 〈d〉 is then selected, provided that 〈d〉 is smaller than 500 km; otherwise, no window is selected. Consequently, for a given window under test, the search yields five or six (depending on the availability of data) background windows that make up the data set used to model the typical background rate. For each background window within the data set , we iteratively fit a polynomial function on the window’s rate time series, progressively increasing the degree of the polynomial from 0 up to 10. If a fit achieves a reduced chi-squared cred 2 value smaller than 2, the iteration is stopped and the corresponding degree n of the polynomial is recorded. Provided that this condition is fulfilled in at least half of the elements of the set of background windows , the average ánñ of the collected degrees is then computed. The number n = áñ ⌈ ⌉ n , i.e., the smallest integer larger than or equal to this average, is then taken as the reference degree to model the background rate for the window under test. Once the background model is established, the algorithm proceeds to its second step by examining the window under test. First, data quality selections are applied to the entire window: if any of the 60 data points therein is missing, the window is not analyzed. In addition, space weather conditions within the window are checked. To this purpose, we classified time periods as described in D. Recchiuti et al. (2023), by employing the SYM-H geomagnetic index averaged over 3 hr intervals. Each interval is then classified to be either “quiet” or “disturbed” according to the corresponding SYM-H value. This classification is used to set a limit on the latitude of analyzed windows: on quiet periods, windows are analyzed if they are contained within the interval of geomagnetic latitude (S. G. Shepherd 2014) [−60°, 60°]; conversely, during disturbed periods, this interval is reduced to [−55°, 55°] in order to avoid spurious triggers induced by solar activity that perturb the rate at higher latitudes.
After these checks, the rate time series within the window is fitted via the predetermined polynomial model. Thereupon, data points deviating significantly from the fitted polynomial f (x), namely those for which the absolute value |ri| of the normalized residual given by
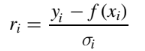
exceeds 3, are identified as outliers, where yi is the measured rate and σi the error on this rate. In addition, on both sides of each detected outlier, adjacent points are also flagged as outliers if their normalized residual exceeds 1. This process effectively extends the outliers set dynamically, by continuing until a point fails to be deemed as an outlier. Upon excluding these outliers, a second fit is carried out on the remaining data points by using the same predetermined degree. Finally, we compute the sum of the normalized residuals, namely
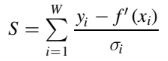
between all 60 data points in the window and the curve f determined by the second fit. If S > 10, the window is flagged as containing an anomaly. Figure 3(a) provides an example of the fitting procedure: in this example, the criterion S > 10 is met and the window is then flagged as anomalous; the window indeed covers the arrival time of GRB 220624A, as discussed in the following section.
3.2. Identification of Outliers with GRBs
The procedure described above allows a statistically robust identification of outliers out of HEPD-01 rate data by detecting significant deviations from expected background levels. The application of the procedure to the whole available HEPD-01 data set, which covers the time span between 2018 August and 2022 June, provides ∼500 anomalous events with an average duration of approximately 5–10 s. In principle, these anomalies can be due to phenomena different from GRBs, for example, disturbances induced by the solar activity. The chance probability, namely the probability of observing an anomaly due to chance and not due to a GRB, was evaluated by computing the fraction of independent windows that the algorithm labels as anomalous over the whole observation period. This probability turns out to be 6.8 × 10⁻⁵ (equal to approximately 4σ). The chance probability corresponds, in this case, to the rate of false detection of a GRB due to the coincidence of a randomly anomalous window with a GRB event. To tag a detected anomaly as a GRB, we matched the timestamps of the detected anomaly with the timestamps of the triggers of the other instruments listed in Section 1. 1 The match was carried out assuming a tolerance ranging from −2 s and +10 s between the HEPD-01 outlier and the corresponding reference timestamp. It is worth pointing out that, for all the outlier windows identified as GRBs, the GRB source location estimated by other instruments was within the line of sight of HEPD-01, unobstructed by the Earth. As an example of GRB identification, the rate at the window centered around the UTC time 1587540136, originally shown in Figure 3(a) and flagged as anomalous, is reported in Figure 3(b) upon subtraction of the background model (blue, solid line of Figure 3(a)). Moreover, Figure 3(b) also reports the trigger time for a GRB, namely GRB 220624A: the matching between the anomalous time window and the GRB trigger time prompts the association between the window and the GRB. The timestamp matching procedure provided 12 anomalies tagged as GRBs: five correspond to previously published observations by HEPD-01 (F. Palma et al. 2023), namely GRB 190114C, GRB 190305A, GRB 190928A, GRB 200826B, GRB 211211A; seven are instead new candidates that were retrospectively identified with signals from GRB 190129B, GRB 200422A, GRB 220624A, GRB 181222B, GRB 201009A, and GRB 200412B.
Characteristics of the Gamma-Ray Bursts Observed by HEPD-01
The 12 outliers identified as GRBs were detected by several other instruments, which provided measurements of their temporal and spectral features as well as, in most cases, their location triangulated in the sky, thus identifying a possible source. In the following, a synthetic description of the features of the seven newly observed GRBs is provided. Similar information for the five previously detected GRBs is can be retrieved from F. Palma et al. (2023).
4.1. GRB 181222B
GRB 181222B, detected by Fermi GBM at T0 = 20: 11: 37 UT on 2018 December 22, (P. Veres 2018), was identified as an extremely bright, short-duration burst. The burst exhibited a T90, namely the time interval of the burst length containing 90% of the total observed counts, of approximately 0.5 s in the 50–300 keV range. The fluence of the event reported by Fermi was 3.44 × 10⁻⁵ erg cm–2 in the 10–1000 keV range, with a peak photon flux of 800 ph s−1 cm–2 measured over a 64 ms interval starting from T0 + 0.14 s. The time-averaged spectrum from T0 to T0 + 1.1 s was best fit by a Band function with a peak energy (Epeak) of 380 keV. The burst was located at R.A. = 311.2°, decl = 22.9° (J2000), with a 1σ statistical uncertainty of 1.6°. The burst was observed also by Konus-Wind, with a fluence of 3.70 × 10⁻⁵ erg cm–2 and a 16-ms peak flux of 2.72 × 10⁻⁴ erg cm–2 s−1 in the 20 keV–10 MeV range. The related time-averaged spectrum is best-fitted by a Band model with Epeak = 365 keV (D. Svinkin et al. 2018). Additional observations were made by telescopes of the Global MASTER Net, with an optical transient identified within the Fermi error box at 2018 December 24 19:07:42 UT (V. Lipunov et al. 2018). Given the broad energy range and low threshold of Konus-Wind and Fermi GBM detections, HEPD-01 detection represents an evidence of high-energy photon emission between ≈0.3 MeV to 50 MeV from this GRB.
4.2. GRB 190129B
GRB 190129B, initially detected by the Konus-Wind, had its T0 recorded at 12:15:34 UT (D. Frederiks et al. 2019a). It exhibited a short and intense burst with a duration of ∼60 s as observed in the 20 keV–10 MeV range. The burst’s fluence was reported to be 5.59 ± 0.40 × 10⁻⁴ erg cm–2. Swift’s X-ray Telescope (XRT) detected an uncatalogued X-ray source (A. Melandri et al. 2019), likely the afterglow of
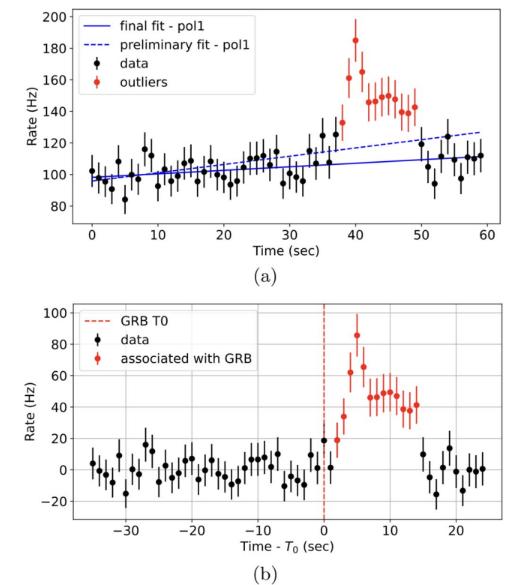
Figure 3. (a) Example of the fitting procedure. Dots and error bars correspond to the measured rate and the related uncertainty. The blue, dashed line is the initial first-degree polynomial that best fits the whole set of 60 data points within the window. Data points colored in red, which significantly deviate from the initial model, are identified as outliers according to the procedure described in the main text. The blue, solid line corresponds to the second first-degree polynomial fit, carried out by excluding outlier points. As the sum of normalized residuals S is equal to 42.5, the window is flagged as anomalous. (b) Rate signal upon subtraction of the background polynomial model. Data points colored in red are identified as outliers according to the procedure described in the main text. The red, dashed vertical line corresponds to the trigger time of GRB 220624A (S. Lesage & C. Meegan 2022).
GRB 190129B, pinpointing it with a precision of 3.0′′ at R.A. (J2000): 117.4610°, decl. (J2000): 0.9348°. AstroSatʼs CZTI also detected GRB 190129B in the 40–200 keV energy range, showing multiple peaks with the strongest at 12:15:45.5 UT (T. Khanam et al. 2019). INTEGRAL SPI-ACS, as part of the IPN triangulation efforts, contributed to localizing GRB 190129B along with Konus Wind and Mars-Odyssey (D. Svinkin et al. 2019), thus improving the precision of the burstʼs position. A high-energy component measured by Konus-Wind and INTEGRAL SPI-ACS is confirmed by HEPD-01 detection in the energy range from 0.3 to 50 MeV.
4.3. GRB 200412B
GRB 200412B was detected by Fermi GBM (B. Mailyan & R. Hamburg 2020), AstroSat CZTI (S. Gupta et al. 2020a), INTEGRAL SPI-ACS (INTEGRAL 2020a) highlighting the burst’s multiwavelength observation capabilities. The first detection was reported by Fermi on 2020 April 12, at T0 = 09:08:40 UT. The burst exhibited a T90 of 12.6 s with a Epeak of 255 keV. The fluence in the 10–1000 keV range was measured at 3.1 × 10⁻⁵ erg cm–2. The burst was also observed by ground-based telescopes in the MASTER Global Robotic Net, which contributed with optical observations shortly after the burst (V. Lipunov et al. 2020). AstroSat CZTI complemented these observations with a similar T90 of 12.5 s, capturing a complex multipeaked light curve that improved the understanding of the burst’s dynamic nature. Moreover, the presence component at higher energies at the end of the burst was detected by Integral SPI-ACS and HEPD-01, as shown in the following section.
4.4. GRB 200422A
GRB 200422A, a long-duration and very bright GRB, was extensively observed by multiple instruments. It was initially triggered by Konus-Wind (K. Hurley 2020) at T0 = 07:22:16 UT. The burst exhibited a multipeaked light curve with a duration of ∼40 s and had emissions detectable up to around 10 MeV. The fluence recorded by Konus-Wind was 5.12 × 10⁻⁴ erg cm–2, measured in the 20 keV–10 MeV energy range. AstroSat CZTI also detected this GRB, observing it in the 40–200 keV energy range. The T90 duration was calculated to amount to 20.46 s (S. Gupta et al. 2020b). The IPN triangulation provided a precise location at R.A. = 196.4°, decl = −19.8°, with an error box of about 1 square degree (K. Hurley et al. 2020). INTEGRAL SPI-ACS detected the GRB with a T90 duration of 12.3 s in the 10–1000 keV energy band and measured a fluence of 3.62 × 10⁻⁴ erg cm–2 (P. Minaev et al. 2020). HEPD-01 also confirmed a long-duration GRB having a duration of about 13 s in the 0.3–50 MeV energy range, thus overlapping with both the INTEGRAL and Konus-Wind detection ranges.
4.5. GRB 201009A
GRB 201009A was detected by several instruments including AstroSat CZTI (S. Gupta et al. 2020c) and INTEGRAL SPIACS (INTEGRAL 2020b). AstroSat CZTI captured the burst at T0 = 03:08:21 UT, with a T90 of 40.20 s, hinting at a longer and more intense emission. The strongest peak for AstroSat was recorded in the 100–500 keV range with a significant count rate. INTEGRAL SPI-ACS also observed a burst, indeed recording a trigger slightly earlier at T0 = 03:08:06 UT, thus supporting the findings of a complex, multipeak emission pattern. HEPD-01ʼs detection of a burst of approximately 5 ± 1 s confirmed the high- energy emission observed by INTEGRAL SPI-ACS.
4.6. GRB 210702A
GRB 210702A was detected by several instruments including Konus-Wind and Swift. Swift-BAT detected the burst at 19:07:13 UT, initially locating it at R.A. (J2000) = 168.57°, decl. (J2000) = −35.74°, with a 3′ uncertainty (A. Y. Lien et al. 2021). The peak energy observed by Konus-Wind was about 376 keV (D. Frederiks et al. 2021). Swift XRT further refined the burstʼs coordinates to R.A. (J2000) = 168.5788°, decl. (J2000) = −35.7411°, with a 1.9′′ radius at 90% confidence (A. Y. Lien et al. 2021). HEPD-01 measured a burst of approximately 10 s in its 0.3–50 MeV channel, which can be added to the one of Konus-Wind to further corroborate a high- energy photon emission during this event.
4.7. GRB 220624A
GRB 220624A was a significant event detected by several observatories, with Fermi GBM detecting it at T0 = 02:58:35 UT

Figure 4. Time-resolved and detection profiles for the 12 GRBs after background subtraction and scaling: GRB 181222B, GRB 190114C, GRB 190129B, GRB 190305A, GRB 190928A, GRB 200412B, GRB 200422A, GRB 200826B, GRB 201009A, GRB 210702A, GRB 211211A, and GRB 220624A. The plots show the recorded rate by HEPD-01 superimposed to the light curves provided by dedicated GRB detectors, whose energy ranges are provided in the plot legends. Each panel corresponds to a specific GRB event (see labels on top of the plots) with time profiles shown relative to the trigger time T0 and corrected for the light travel time between the two compared instruments. The light curves for FERMI GBM or Swift-BAT (in green) and SPI-ACS (in red) are normalized to the maximum of the HEPD-01 data to ensure comparability across different detector sensitivities. Each curve is detrended via a suitable background model tailored for that specific time region, which leads to an enhancement of the accuracy of the observed GRB signal. Shaded gray areas represent the time interval considered for the extraction of the GRB temporal features.
on 2022 June 24, (S. Lesage & C. Meegan 2022). This long duration burst lasted approximately 285 s and was observed up to 10 MeV energy. The total fluence recorded was 1.550 × 10⁻⁴ erg cm–2 for the first main emission episode, with a peak energy of 486 keV. The event was also detected by Konus-Wind (D. Frederiks et al. 2022) and CALET (Y. Akaike et al. 2022), with both observatories providing data on the burst’s light curve and spectral characteristics. The shared analysis of the data obtained by these instruments provided a comprehensive multiwavelength view of GRB 220624A, pinpointing its celestial coordinates at R.A. = 179°, Decl. = 20°, with a precision of 1°. HEPD-01 measured a long burst in its 0.3–50 MeV channel too.
The HEPD-01 GRB Catalog
The HEPD-01 on board the CSES-01 satellite successfully identified and recorded the time profiles of 12 GRBs over its operational period. This section lists the detailed HEPD-01 observations of these GRBs in comparison with INTEGRAL SPI-ACS, Fermi GBM, and Swift-BAT, along with a comprehensive summary of the characteristics extracted from HEPD 01 data.
5.1. Summary of Observations
The time profiles of the HEPD-01 measured rates for the 12 identified GRBs are shown in Figure 4. Despite the higher energy range of HEPD-01, the rate, timing, and shape of the detected GRBs show a remarkable
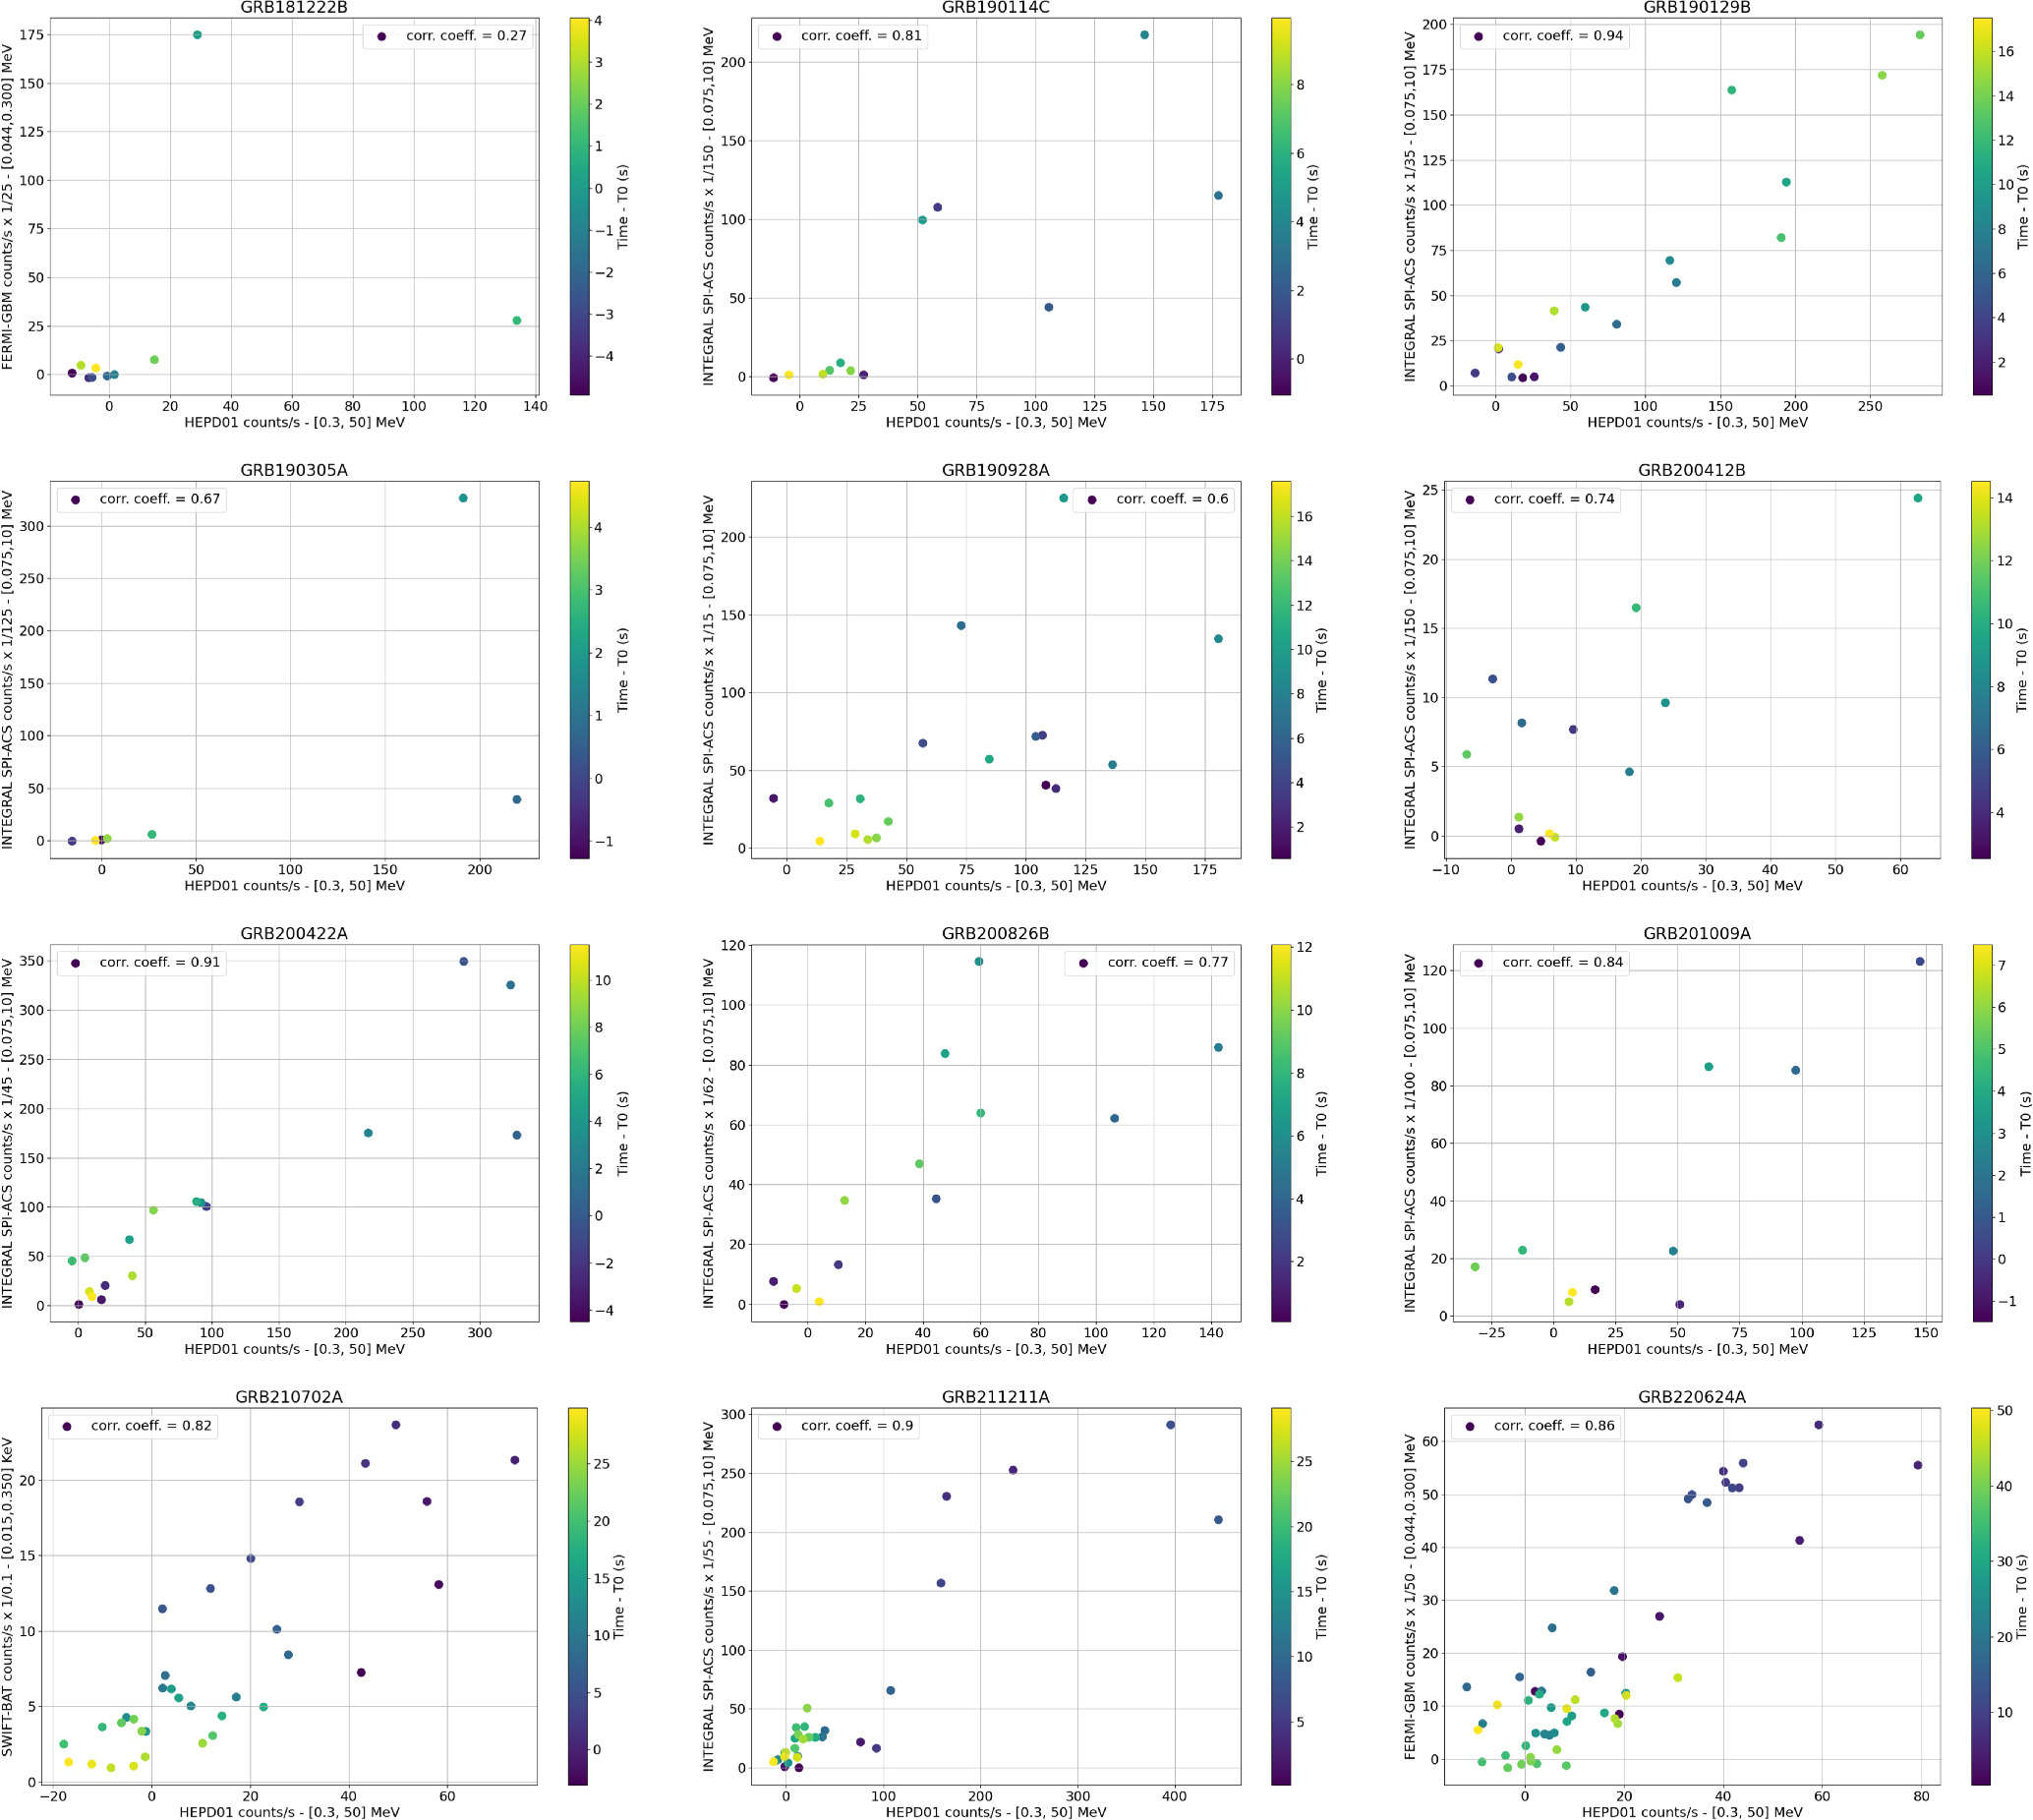
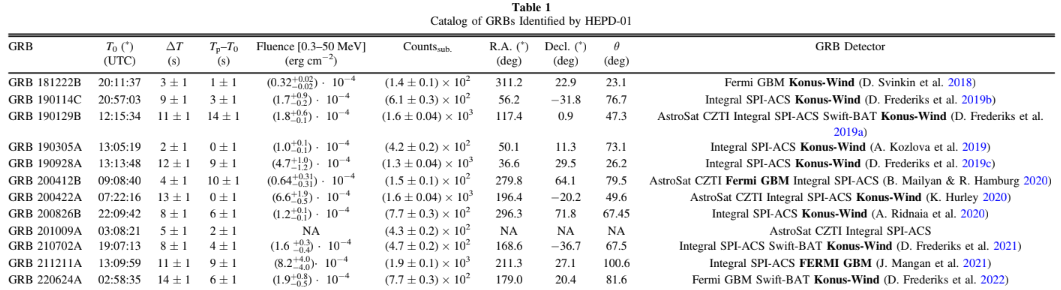
Figure 5. Correlation analyses between HEPD-01 and dedicated GRB detectors for the 12 GRBs after background subtraction and scaling: GRB 181222B, GRB 190114C, GRB 190129B, GRB 190305A, GRB 190928A, GRB 200412B, GRB 200422A, GRB 200826B, GRB 201009A, GRB 210702A, GRB 211211A, and GRB 220624A. Each plot correlates the GRB detector count scaled after background subtraction as in Figure 4 vs. the rate measured by HEPD-01 (in Hz). Instrument and energy ranges are reported on the axis. The color scale represents the post-trigger time T0, considering the light travel time between the two compared instruments. All plots show positive correlation coefficients.
agreement with data recorded by INTEGRAL SPI-ACS, FERMI GBM, and SWIFT-BAT (light curve data accessed from FERMI-GBMdata 2024; INTEGRALdata 2024; SWIFT data 2024). For GRB 190129B, GRB 190928A, GRB 200412B, and GRB 211211A, secondary structures of the main peak are recorded by HEPD-01, reproducing the shape of the main emission also for possible multistage emission processes; GRB 200422A, GRB 210702A, and GRB 220624A instead show an extended structure that gradually fades out after the main peak, thus suggesting a residual emission or secondary burst activity at high energy. These observations are displayed in Figure 5, in which correlation plots between the rate measured by HEPD-01 and the related light curve are shown. Despite the different energy ranges of HEPD-01 and the dedicated gamma-ray detectors, the agreement between the two measurements is apparent. Large and positive correlation coefficients highlight the coherence of the observations, thereby enhancing our understanding of the GRBs under investigation within the HEPD-01 energy range, which mostly lies above or only in a partial overlap with those of the other instruments. Fluences of the 12 identified GRBs were calculated. First, upon background subtraction, we computed the value of the integrated HEPD-01 counts for each of the considered GRBs. We then retrieved the spectral parameters Epeak, α, and β of the Band model (D. Band et al. 1993) measured by dedicated GRB instrument. The spectral shape described by these parameters is then used, in combination with the effective area of HEPD-01 (see Figure 1), to compute fluences out of background-subtracted counts. A systematic error accounting for the uncertainty of the spectral parameters and on the determination of the effective area was considered. The results are reported in Table 1
Note. The table includes GRB name; start time (T0); duration of the GRB ΔT; time of count peak (Tp–T0); fluence in erg cm–2; total counts; R.A. and decl. celestial coordinates; θ, the angle between the direction of HEPD-01 axis and the GRB arrival direction; and instruments that detected the event among those listed in Section 1. Data for the fields labeled with (*) are taken from dedicated GRB instruments. Unavailable data are indicated by “NA.” For GRB 201009A, no spectral or pointing data was found and therefore fluence could not be reliably estimated. For each event, the instrument used for the estimation of the spectral parameters of the Band function, which is used to estimate fluence out of HEPD-01 data, is reported in bold and a reference to the corresponding GCN circular is provided. Errors on fluence estimates are given as the squared root sum of statistical and systematic errors.
Table 1 summarizes the properties of each detected GRB. The novel background modeling approach enhances the capability to single out event-related counts within the measured rate of HEPD-01, thus improving fluence estimation with respect to previous works, and reducing the associated systematic uncertainties.
5.2. Stacked Analysis
A stacked analysis was carried out, where the signals from the HEPD-01 detector were pooled for all the GRB triggers of the other instruments listed in Section 1 and occurred between 2018 August and 2022 June. The signal extraction was performed by aligning the time series data around each GRBʼs trigger time (T0), by considering a symmetric window of ±30 seconds and excluding the 12 GRB already found. The analysis methodology and the selections are the same as described in Section 3. The stacked analysis did not reveal any additional statistically significant signal beyond those already identified. Consequently, the catalog of 12 GRBs recorded by HEPD-01 between 2018 August and 2022 June is considered to be comprehensive and providing useful data in the HEPD-01 energy range from the MeV level to tens of MeV.
Conclusions
We demonstrated the HEPD-01 capability of detecting GRBs, with improved sensitivity due to a novel method of analysis. Such a method relies on the identification of significant deviations from the background, which are a posteriori attributed to GRBs occurred between 2018 August and 2022 June. Using this methodology, and combining it with temporal coincidence and shape comparison with signals detected by other instruments, led to the observation of 12 GRBs in the HEPD-01 visibility range and with fluence above 0.3× 10⁻⁴ erg cm−2. The novel analysis provides detailed time profile features and fluence estimations in the energy range 0.3–50 MeV, scarcely covered by other instruments. Valuable insights about the time-energy evolution of GRBs can be derived by comparing the high-energy measurement of HEPD-01 with lower energy detections from other observatories. The ability of HEPD-01 to synchronously operate with other detectors and its peculiar energy range offer a new point of view for the validation and investigation to GRBs, enhancing the overall understanding of these phenomena and their physical properties. A stacked analysis aimed to compare HEPD-01 observations with all known candidates provided no evidence of additional signals besides the 12 GRBs mentioned in this paper. This result provides an evidence that the HEPD-01 catalog is comprehensive and provides valuable data within its energy range. An improved version of the detector, HEPD-02, with a peak effective area 10 times larger than HEPD-01, is expected to be launched on board CSES-02 in late 2024. HEPD-02 will feature an improved trigger logic with a dedicated mode for GRB detection, which will further expand the reach of the mission with respect to these events. The energy range available for GRB detection will be increased with respect to HEPD-01 and will cover the range between 0.5 and 100 MeV, showing a peak effective area of 150 cm2 at about 10 MeV (A. Lega et al. 2023; F. M. Follega 2023). The demonstrated capabilities of HEPD-01, combined with the anticipated enhancements of HEPD-02, highlight the potential for significant advancements in the field of GRB detection and analysis, by adding a new charged particle detector into the broader network of GRB detection tools.
Acknowledgments
This work makes use of data from the CSES mission, a project funded by the China National Space Administration (CNSA), China Earthquake Administration (CEA) in collaboration with the Italian Space Agency (ASI), National Institute for Nuclear Physics (INFN), Institute for Applied Physics (IFAC-CNR), and Institute for Space Astrophysics and Planetology (INAF-IAPS). This work was supported by the Italian Space Agency in the framework of the “Accordo Attuativo 2020-32.HH.0 Limadou Scienza+” (CUP F19C20000110005), the ASI-INFN Agreement No. 2014-037-R.0, addendum 2014-037-R-1-2017, and the ASI-INFN Agreement No. 2021-43-HH.0.